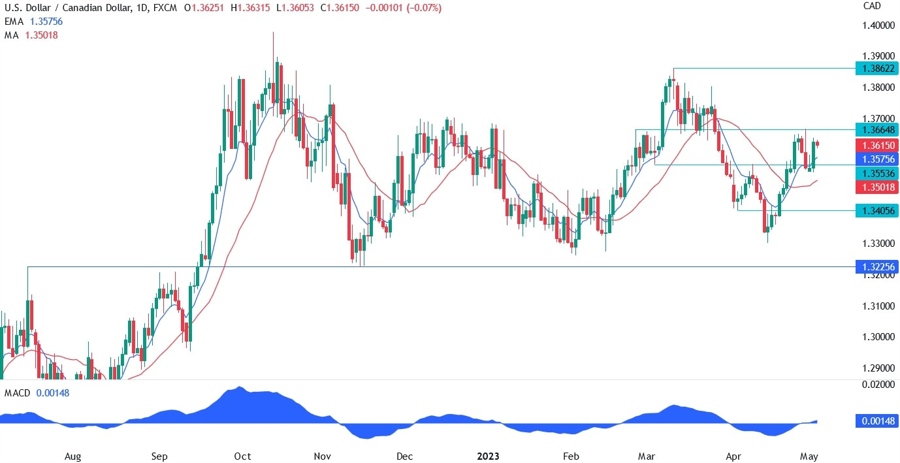
On the daily chart below for USDCAD , we can see that after a huge rally back towards the key support now turned resistance at 1.3664, the price has stalled and it’s now consolidating between the resistance and the support at 1.3553. The moving averages have crossed to the upside as the trend changed from bearish to bullish.
Another thing to note is the weakness in oil as the global growth is threatened by restrictive monetary policies and recessionary data. The CAD being a commodity currency suffers the most in case the risk sentiment turns sour.
USDCAD technical analysis
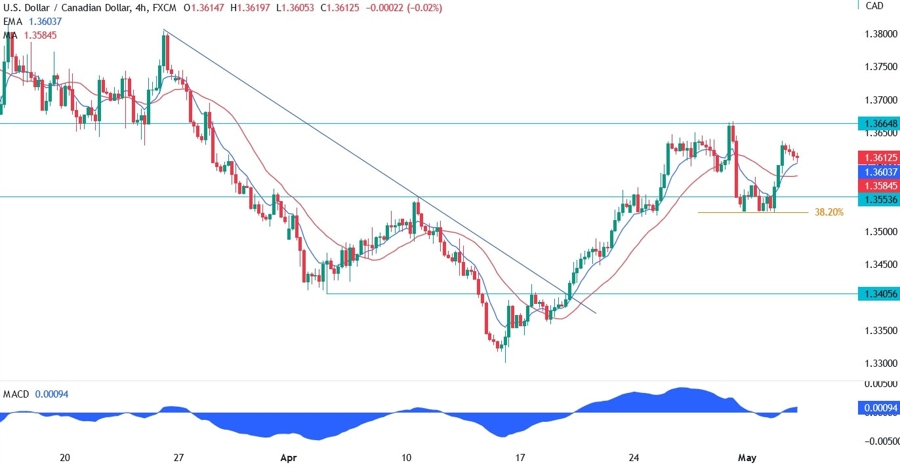
On the 4 hour chart below, we can see that there were strong sellers ready at the 1.3664 resistance as the price got pushed down hard. The pullback has stalled at the 1.3553 support and the 38.2% Fibonacci retracement level where buyers entered the market and pushed the price back up towards the resistance. There shouldn’t be a clear direction until the price breaks out on either side supported by a fundamental catalyst. Today we have the ISM Services PMI and the FOMC policy announcement, so watch out.
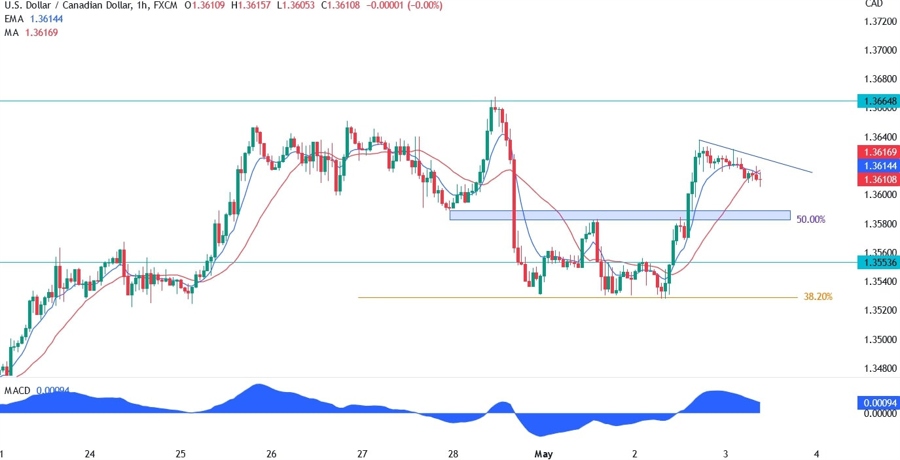
On the 1 hour chart below, we can see that there’s a support zone in the 1.3585 price level where there’s also confluence with the 50% Fibonacci retracement level. The buyers may lean on that zone for another push to the upside, while the sellers would want to see the price break below the level to pile in and try a breakout. A break above the blue counter-trendline may also give the buyers some conviction for a push towards the resistance or beyond.