USD
- The Fed left interest rates unchanged as expected at the last meeting with basically no change to the statement.
- Fed Chair Powell stressed once again that they are proceeding carefully as the full effects of policy tightening have yet to be felt.
- The latest US Core PCE came in line with forecasts with the disinflationary progress continuing steady.
- The labour market has been showing signs of weakening lately but last week we got some strong releases with the US Jobless Claims and the NFP coming in strongly.
- The latest ISM Manufacturing PMI missed expectations falling further into contraction, while the ISM Services PMI beat forecasts holding on in expansion.
- The University of Michigan Consumer Sentiment survey came in much better than expected with inflation expectations tumbling.
- The hawkish Fed members recently shifted their stance to a more neutral position.
- The market expects the Fed to start cutting rates in Q2 2024.
CAD
- The BoC kept the interest rate steady at 5.00% as expected with the usual caveat that it’s prepared to raise the policy rate further if needed.
- BoC Governor Macklem recently has been leaning on a more neutral side as inflation continues to abate.
- The recent Canadian CPI missed expectations across the board and the underlying inflation measures eased, which was a welcome development for the BoC.
- On the labour market side, the latest report beat expectations although the unemployment rate ticked higher again.
- The market expects the BoC to start cutting rates in Q2 2024.
USDCAD Technical Analysis – Daily Timeframe
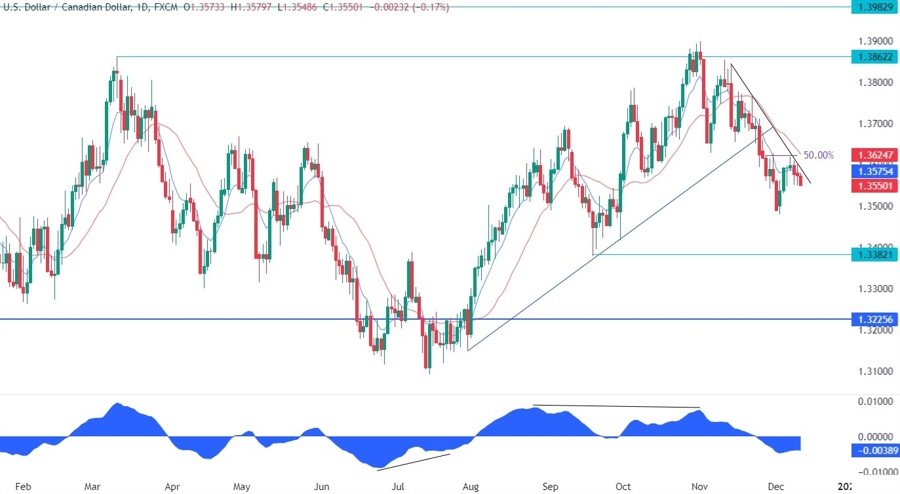
On the daily chart, we can see that USDCAD pulled back into the downward trendline where we had also the confluence with the 50% Fibonacci retracement level and the red 21 moving average. That’s where the sellers stepped in with a defined risk above the trendline to position for another drop into the swing low at 1.3382. The bias remains bearish as long as the price stays below the trendline, so the buyers will need the price to break higher to start targeting new higher highs.
USDCAD Technical Analysis – 4 hour Timeframe
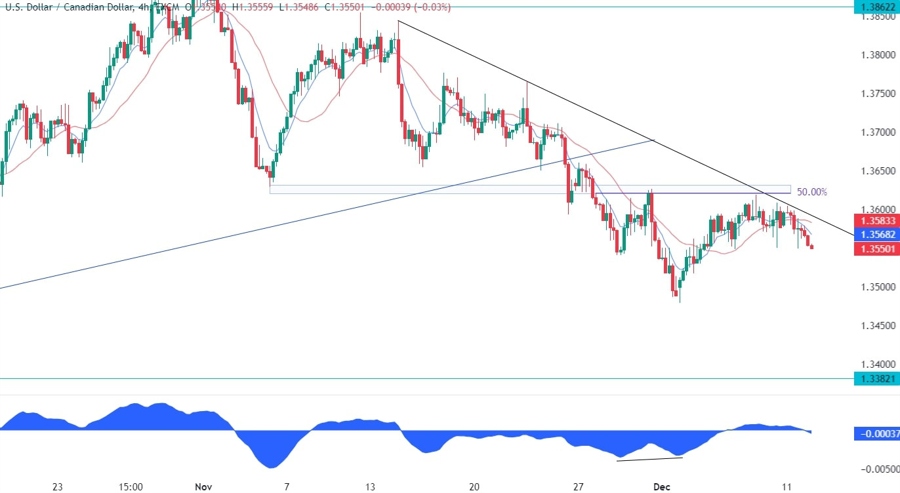
On the 4 hour chart, we can see that the latest leg lower diverged with the MACD which is generally a sign of weakening momentum often followed by pullbacks or reversals. In this case, we got the pullback into the trendline where the price got rejected from. The moving averages crossover suggests that the pullback might have ended, and we are now heading to new lows with the target for the sellers standing at the 1.3382 level.
USDCAD Technical Analysis – 1 hour Timeframe
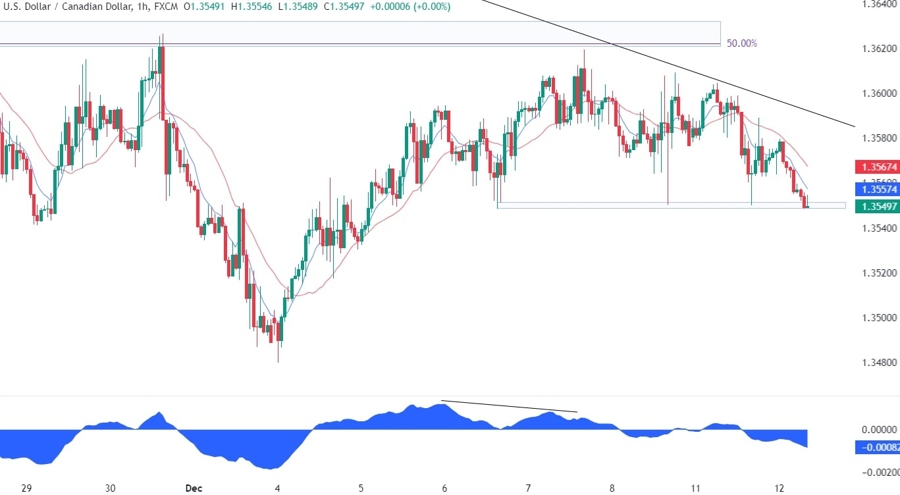
On the 1 hour chart, we can see that we had another divergence with the MACD right into the key resistance zone and the trendline before the fall. We have now a key support around the 1.3550 level where the price has been bouncing from for several times without breaking below it. This consolidation between the trendline and the 1.3550 support is forming a descending triangle. The price can break on either side of the pattern, but what follows next is generally a strong and sustained trend in the direction of the breakout.
Upcoming Events
This week is going to be a big one with the US CPI and the FOMC rate decision on the agenda. We begin today with the release of the US CPI report where the market will want to see how the disinflationary trend is going. Tomorrow, we have the US PPI data followed by the FOMC rate decision where the Fed is expected to keep interest rates unchanged. On Thursday, we will see the US Retail Sales and Jobless Claims figures, while on Friday we conclude the week with the US PMIs.


