US
- The Fed left interest rates unchanged as expected with basically no change to the statement.
- Fed Chair Powell stressed once again that they are proceeding carefully as the full effects of policy tightening have yet to be felt.
- The recent US Core PCE came in line with expectations.
- The labour market is starting to show some weakness as Continuing Claims are now rising at a fast pace and the NFP data last Friday missed across the board.
- The US Consumer Confidence fell for the third consecutive month although the data beat expectations.
- The US ISM Manufacturing PMI last week missed expectations by a big margin, followed later on Friday with a disappointing ISM Services PMI, although the index remained in expansion.
- The market doesn’t expect the Fed to hike anymore.
Canada
- The BoC left interest rates at 5.00% as expected but remains prepared to raise rates further if needed.
- BoC Governor Macklem delivered a less hawkish speech in the press conference compared to his previous remarks.
- The recent Canadian CPI missed expectations across the board and the underlying inflation measures eased, which was a welcome development for the BoC.
- On the labour market side, the latest report missed expectations across the board with negative figures in full-time employment and a slowing wage growth, which is going to be another positive outcome for the central bank.
- The market doesn’t expect the BoC to hike anymore.
USDCAD Technical Analysis – Daily Timeframe
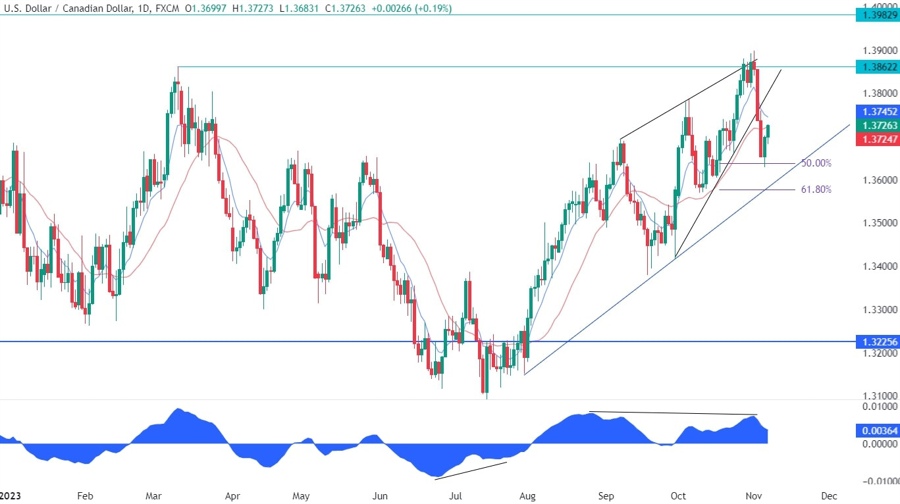
On the daily chart, we can see that the USDCAD broke decisively below the upward trendline and extended the selloff following the disappointing NFP data. The pair bounced yesterday on the 50% Fibonacci retracement level and it’s now approaching the broken trendline. Will we get a classic “break and retest” pattern? From a risk management perspective, the buyers would have an even better risk to reward setup around the major blue trendline.
USDCAD Technical Analysis – 4 hour Timeframe
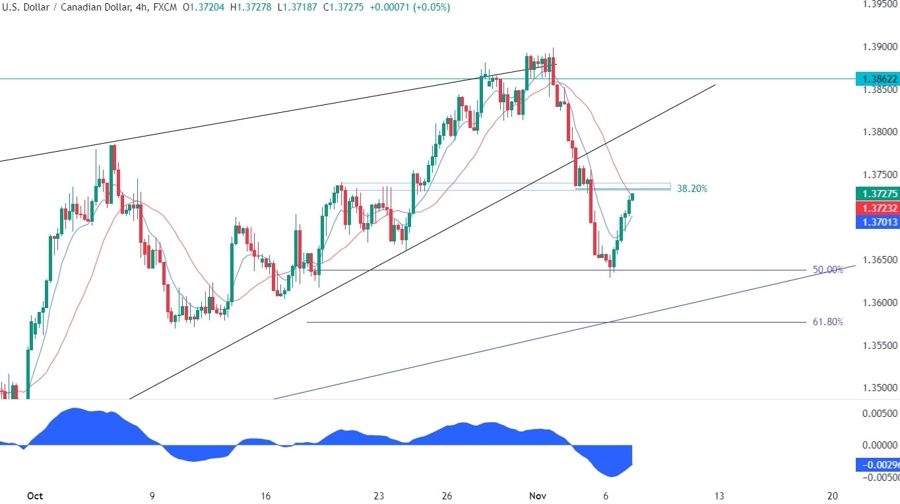
On the 4 hour chart, we can see that the price is now getting closer to a strong resistance around the 1.3740 level where we can find the 38.2% Fibonacci retracement level and the red 21 moving average for confluence. This is where the sellers are likely to step in again with a defined risk above resistance to position for a drop into the major blue trendline.
USDCAD Technical Analysis – 1 hour Timeframe
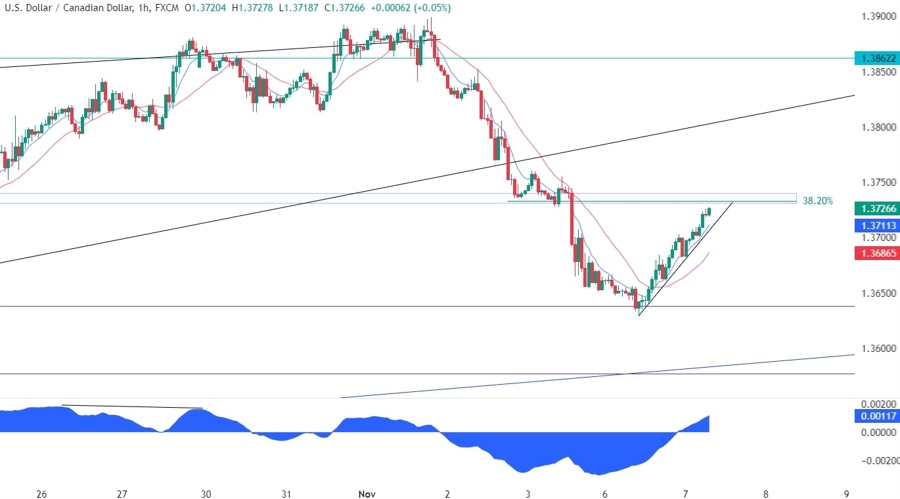
On the 1 hour chart, we can see that the current bullish momentum is defined by the upward minor trendline. More conservative sellers may want to see the price breaking below the trendline before piling in and position for a drop into the major trendline. The buyers, on the other hand, will want to see the price breaking higher to increase the bullish bets into the broken trendline where the sellers will go for another try.
Upcoming Events
This week is pretty empty on the data front with just the US Jobless Claims on Thursday and the University of Michigan Consumer Sentiment on Friday. The market is likely to focus on the US Jobless Claims on Thursday given the recent weakness in the labour market data.


