The USDCAD has established a clear trading range this week, carving out a high of 1.3606 and a low of 1.3524 during Monday’s session. Since that initial volatility, the pair has tightened into a "coil" pattern, printing a series of lower highs and higher lows through Tuesday and into today’s trade.
While the price recently pushed to a fresh daily high of 1.3596, it remains capped below the psychological 1.3600 level and yesterday’s peaks.
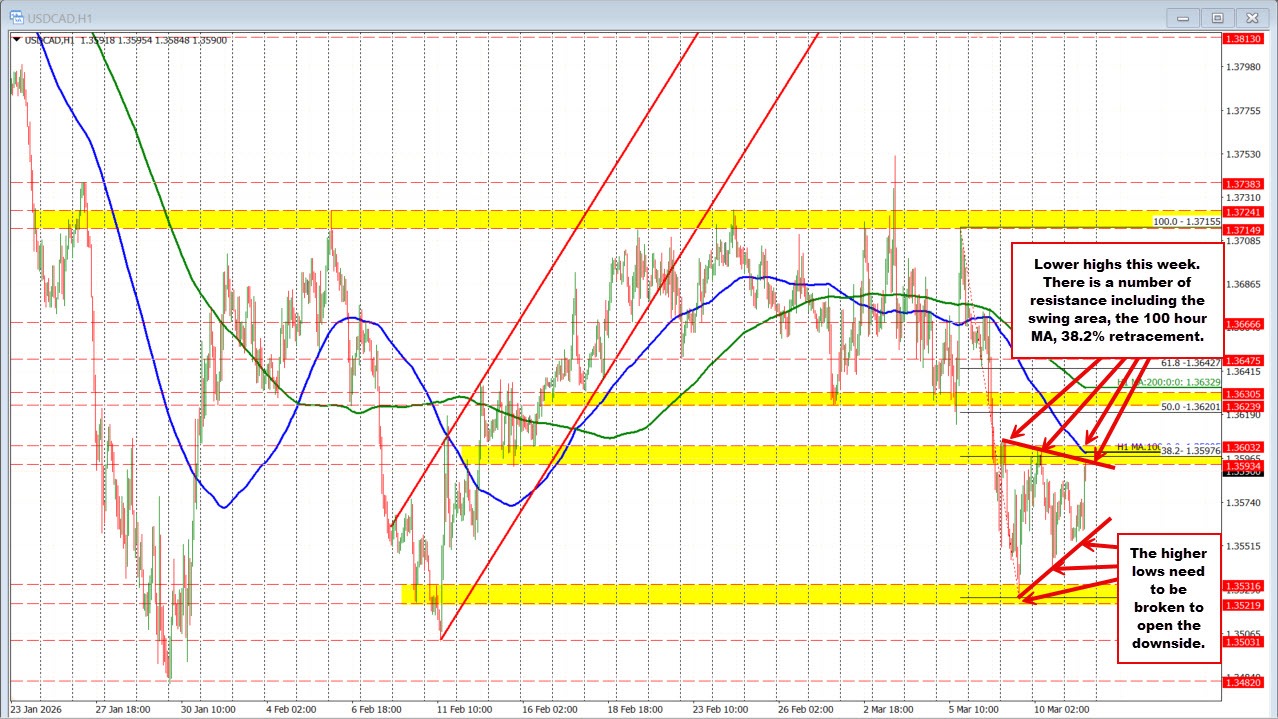
The Resistance Ceiling
The hourly chart reveals a formidable "confluence zone" that bulls must overcome to shift the momentum. This resistance cluster includes:
A critical swing area: 1.3593 – 1.3603.
Fibonacci Resistance: The 38.2% retracement of last Thursday’s decline, situated at 1.35976.
Moving Average: The falling 100-hour MA, currently hovering at 1.3599.
A sustained break above this ceiling would likely trigger a move toward the 50% midpoint at 1.3620. Beyond that, the falling 200-hour MA at 1.3633 and a secondary swing area (1.3624 – 1.3631) act as the next major targets for buyers.
The Bearish Counter-Case
If the pattern of lower highs persists, look for a rotation back toward the session lows. Key support levels to watch include:
Today’s Low: 1.3556.
Yesterday’s Low: 1.3545.
Weekly Floor: 1.35248.
A break below the weekly low would be required to shift the technical bias from neutral to bearish.
In the video above, Greg Michalowski of InvestingLive.com outlines in detail from a technical perspective as the price of USDCAD rises but runs into a cluster of technical targets.