Last week, the Federal Reserve decided to pause its tightening cycle, maintaining interest rates at a range of 5.00-5.25%. The Federal Open Market Committee (FOMC) is awaiting further economic data before determining whether to implement another rate increase. Their aim is to carefully adjust their policy, aiming for a sufficiently restrictive level that can reduce inflation without causing significant economic hardship.
In contrast, the Bank of Canada (BoC) surprised the markets by raising interest rates recently. This decision stems from their dissatisfaction with the disinflationary trend observed during the first quarter of 2023. The BoC deemed it appropriate to increase the interest rate to address this concern. This divergence in monetary policy had a positive impact on the Canadian Dollar and resulted in the breakout of the key support level at 1.32.
USDCAD Technical Analysis – Daily Timeframe
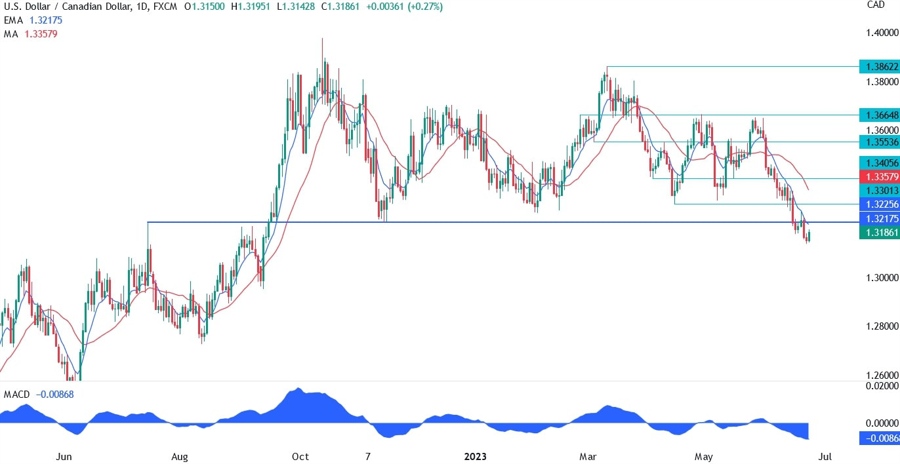
On the daily chart, we can see that USDCAD is trading below the key 1.3225 support and it’s now pulling back in what could be a classic “break and retest” trade. In fact, we are likely to find sellers leaning on that 1.3225 resistance where we will also find the blue 8 moving average for confluence. On the downside, the target should be the 1.30 handle. The buyers, on the other hand, will need to break above the 1.3225 level to start getting some conviction for more upside and target the 1.34 handle.
USDCAD Technical Analysis – 4 hour Timeframe
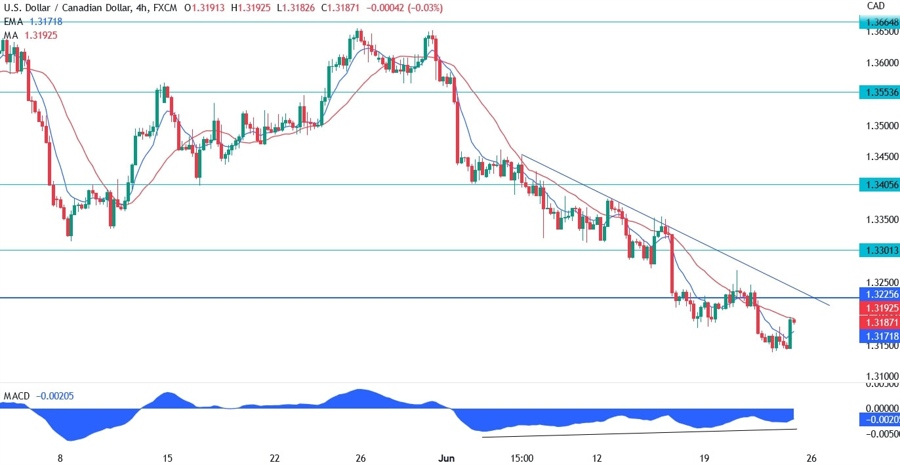
On the 4 hour chart, we can see that the whole move lower since the 1.34 level has been diverging with the MACD. This is generally a sign of weakening momentum often followed by pullbacks or reversals. In this case, the pullback should end at the downward trendline where there’s also the previously mentioned 1.3225 resistance and daily 8 moving average. If the sellers fail at this resistance zone and the price breaks out, the buyers are likely to pile in with more conviction and target the 1.34 handle.
USDCAD Technical Analysis – 1 hour Timeframe
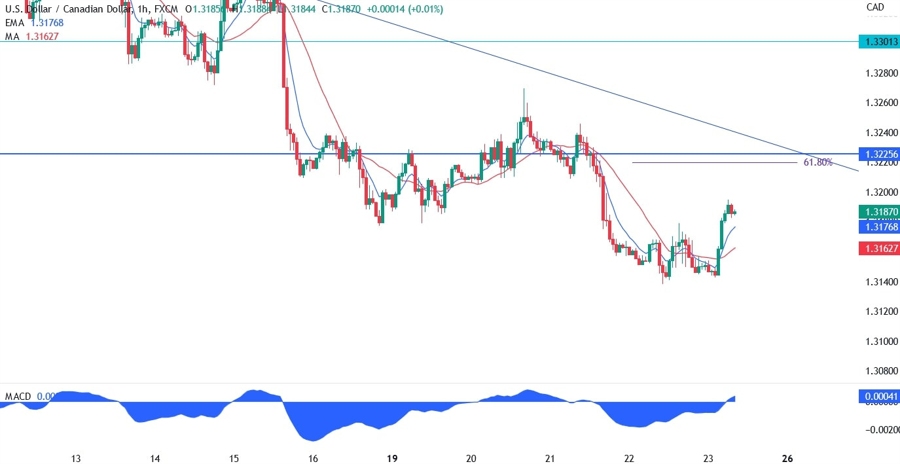
On the 1 hour chart, we can see that for further confluence, we also have the 61.8% Fibonacci retracement level at the 1.3225 resistance. This zone will be a make it or break it moment for the sellers as a move above the trendline would invalidate the bearish setup and lead to a squeeze higher.
Today, we will see the US PMIs and it’s likely that higher than expected data leads to US Dollar strength as the market would price in more hikes, and lower than expected figures lead to more weakness in the USD as the market would price out the July hike.
See also the video below:


