USD
- The Fed left interest rates unchanged as expected at the last meeting and dropped the tightening bias in the statement.
- The US PCE came in line with expectations.
- The US Jobless Claims missed expectations although the data is still in the recent ranges.
- The latest US PMIs increased further from the prior month with the Manufacturing PMI beating expectations and the Services PMI missing.
- The US Consumer Confidence missed expectations across the board.
- The market expects the first rate cut in June.
CAD
- The BoC left interest rates unchanged at 5.00% as expected and dropped the language about being prepared to hike if needed.
- The latest Canadian CPI missed expectations across the board with the underlying inflation measures falling, which will be a welcome development for the BoC.
- On the labour market side, the latest report beat expectations but we saw a contraction in full-time employment and a fall in wage growth.
- The Canadian PMIs improved in January although they remain both in contractionary territory.
- The market expects the first rate cut in June.
USDCAD Technical Analysis – Daily Timeframe
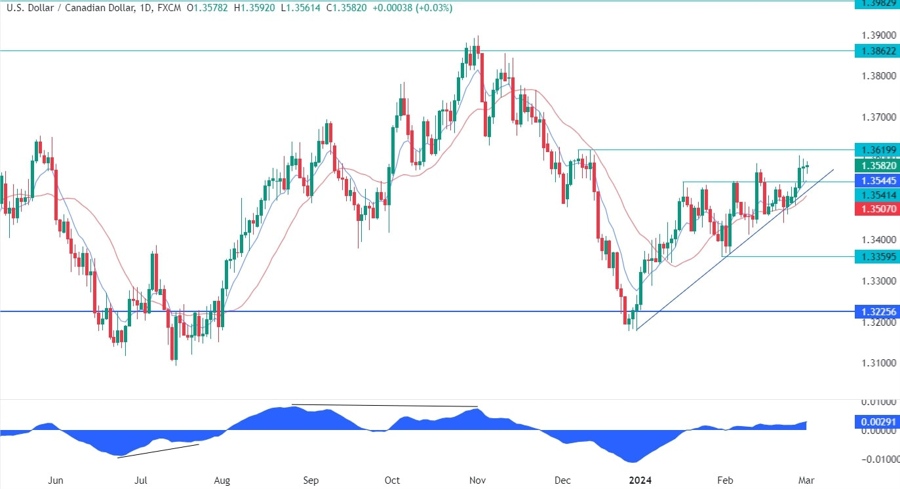
On the daily chart, we can see that USDCAD eventually bounced around the key trendline and extended the rally into the 1.36 handle. We are now trading around the swing level at 1.3619 and this is where we can expect the sellers to step in with a defined risk above the level to position for a drop into the lows. The buyers, on the other hand, will want to see the price breaking higher to invalidate the bearish setup and increase the bullish bets into the 1.3862 level.
USDCAD Technical Analysis – 4 hour Timeframe
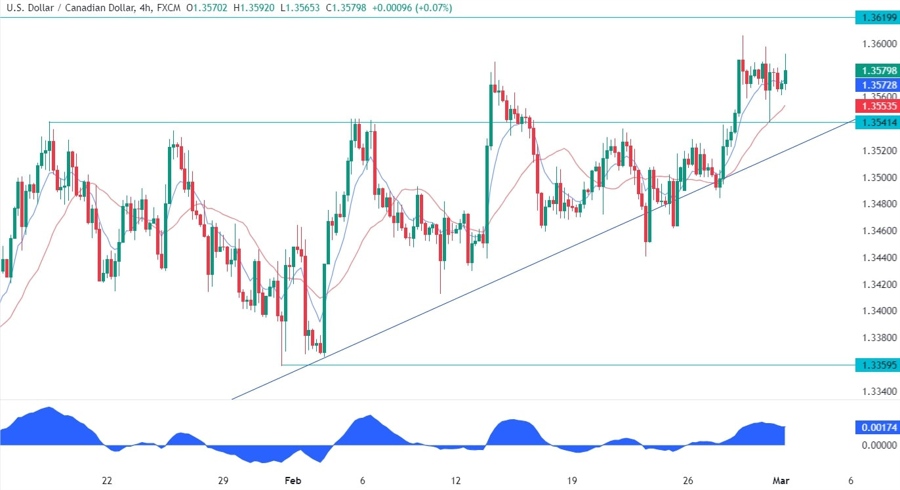
On the 4 hour chart, we can see more closely how the price bounced around the trendline and rallied all the way up to the 1.36 handle. The price yesterday pulled back to retest the 1.3541 resistance turned support and continued higher as new buyers stepped in with a defined risk below the trendline. The sellers will need the price to break below the trendline to turn the trend around and increase the bearish bets into the lows.
USDCAD Technical Analysis – 1 hour Timeframe
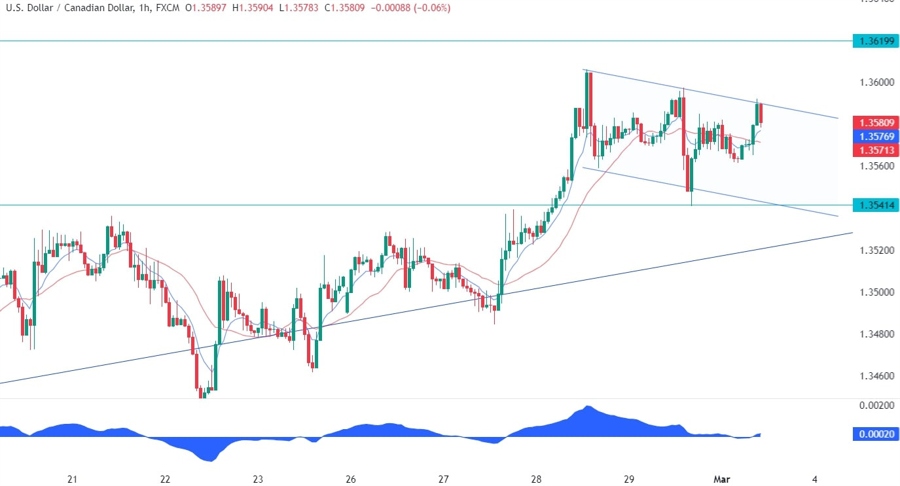
On the 1 hour chart, we can see that the recent price action might have formed a bullish flag. The buyers will need the price to break the top trendline to confirm the pattern and position for a break above the 1.3619 level. The sellers, on the other hand, will want to see the price reversing and breaking below the major upward trendline to invalidate the bullish setup and position for a drop into the lows.
Upcoming Events
Today the only notable event will be the release of the US ISM Manufacturing PMI.


