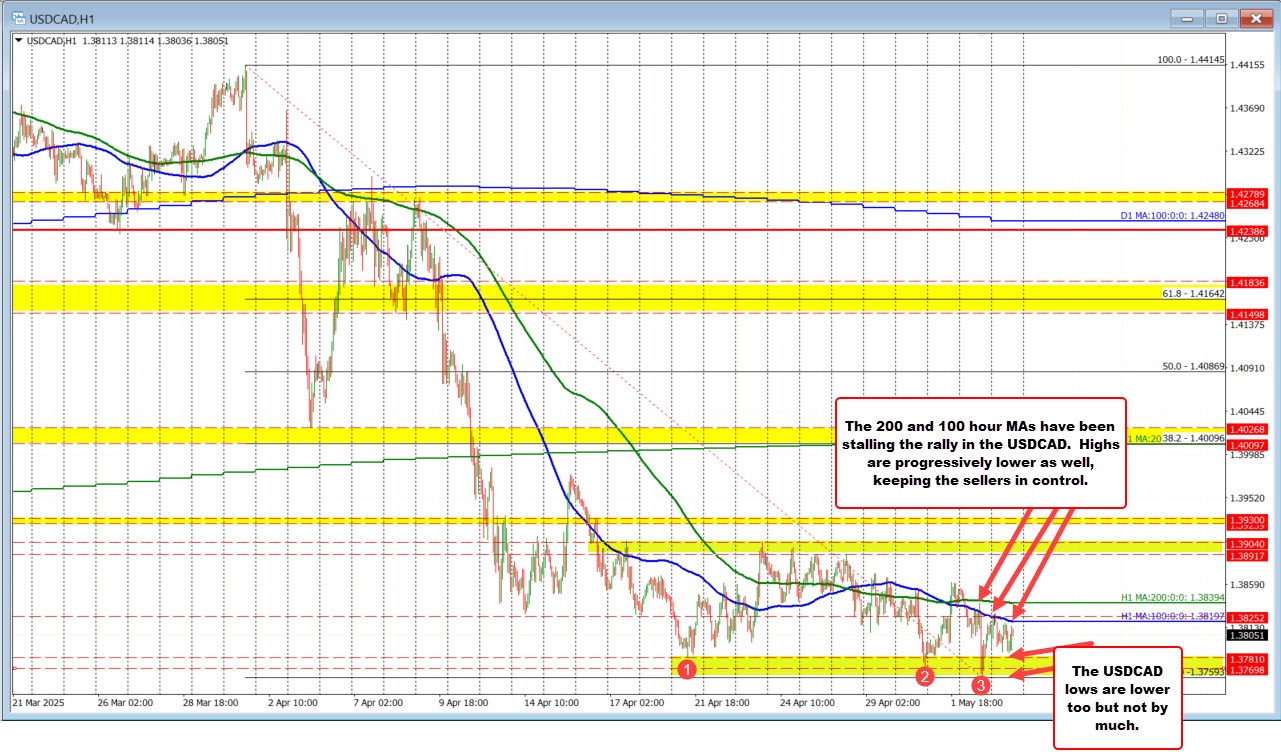
The USDCAD continues to trade with a bearish tilt as the 100-hour (1.38197) and 200-hour (1.38394) moving averages act as a ceiling for price action. Each of the last three upside attempts has stalled near these levels, reinforcing their role as risk-defining resistance.
While lows have edged slightly lower, downside momentum has been limited. Still, the inability to build sustainable upside suggests sellers remain in control, especially while price stays below the moving averages.
A move above 1.38394 would shift the near-term bias, but until then, rallies remain opportunities for sellers.
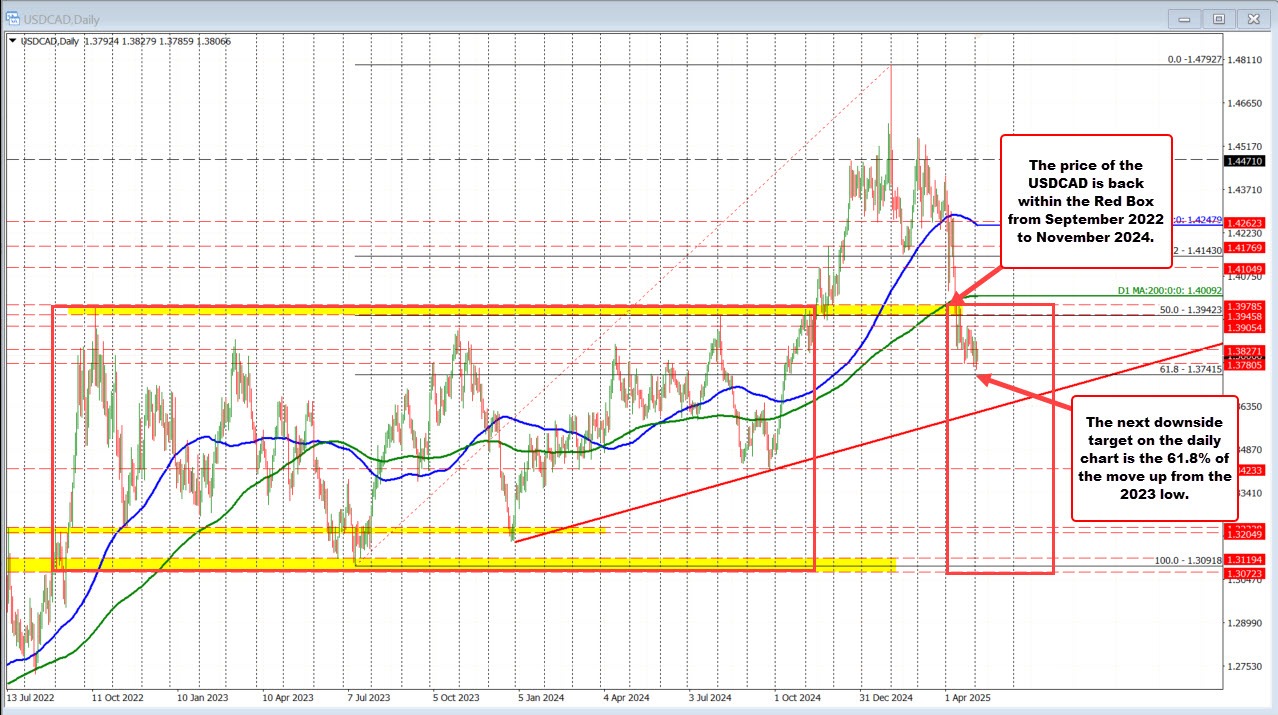
Taking a broader look at the daily chart, the next key target below the low price from Friday comes in at 1.37415 which represents the 61.8% retracement of the move up from the 2023 low. It is also near swing lows from mid-October before the price started to race into the upside.
Another broader look from the daily chart has the back within the up-and-down consolidation range that prevailed from September 2022 until November 2024 (see red box on the chart below).
Key levels:
Resistance (risk/bias-defining): 1.38197 (100-hour MA), 1.38394 (200-hour MA)
Support: 1.3781 (low from April 14), 1.37698 (low from April 30), 1.37593 (low from May 2)


