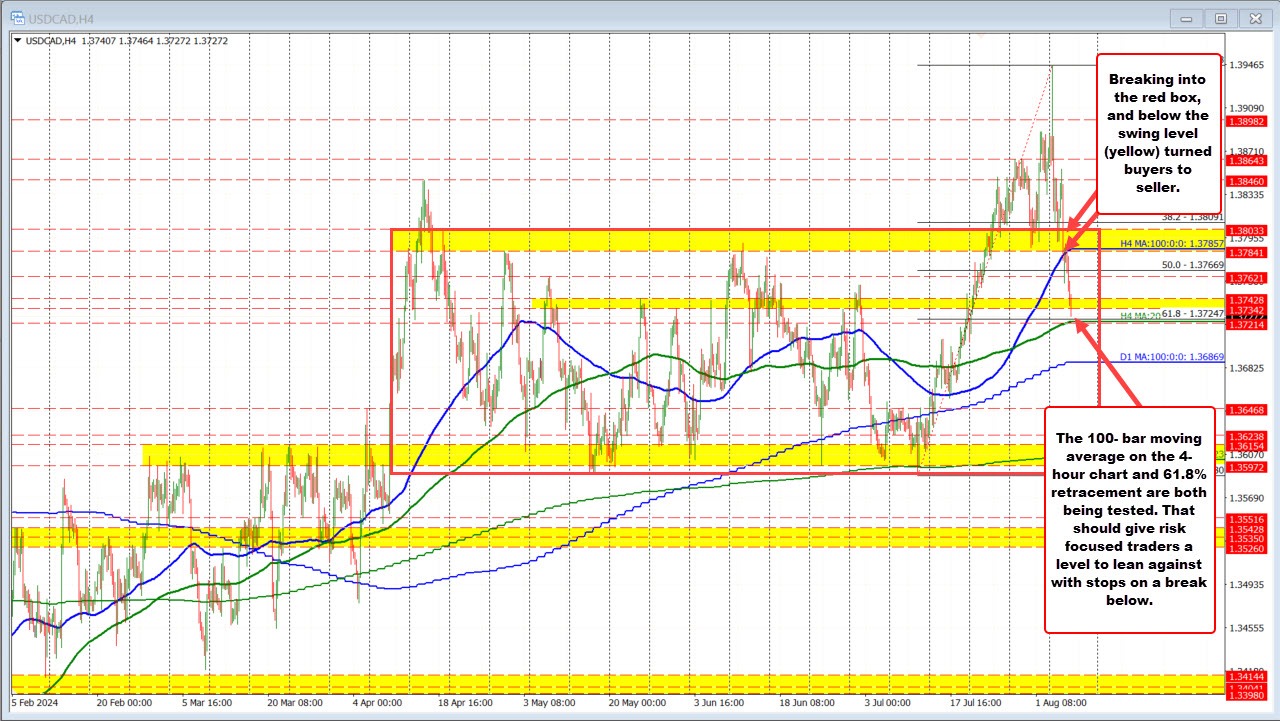
The USDCAD fell back within the gut of the "red box" that can find the pair for most of April to July. That red box came between 1.3588 and 1.3803. Yesterday the price fell back below the high of that red box and also the high of a swing area between 1.3784 and 1.3803. In addition, the rising 100 bar moving average on the 4-hour chart was broken at 1.37857. That is a lot of breaking and the buyers turned to sellers.
The move lower has extended into the North American session with the price extending down toward the 61.8% retracement of the move up from the July low and also the rising 200 bar moving average on a 4-hour chart. Both of those levels come near 1.3725. The low price today just reached 1.37262.
What next?
With the price moving down from 1.39452 and 1.3724 in less than three trading days, there should be some dip buying against the two technical levels. However, if broken I would expect further selling toward the 100-day moving average at 1.36869.