The USDCAD trended higher from the December 8 low. That trend move started at 1.25967 and peaked at 1.29355 (the move of about 339 pips in five trading days).
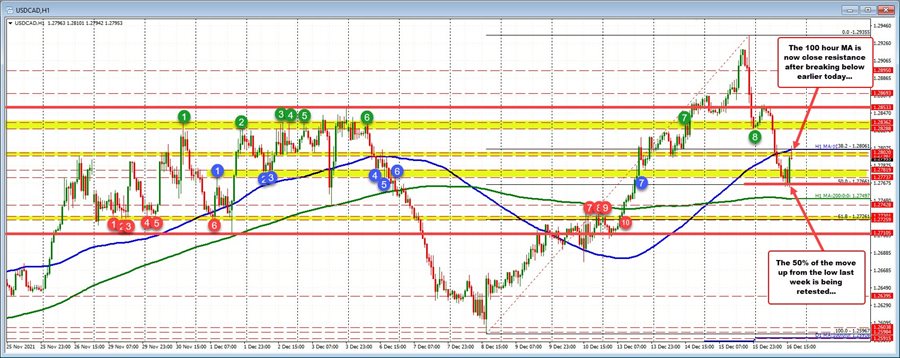
The price has rotated down from the peak yesterday, and first retested a swing area between 1.2828 and 1.28362, before making another push lower through the 100 hour moving average (blue line) currently at 1.2806. The low price stalled at 1.2763 which was just below the 50% midpoint of the December trading range at 1.27661.
The price has subsequently pushed back higher and tried to get back above the 100 hour moving average, but is having some apprehension near that level.
What next?.
The sellers have taken back control after the run higher over the previous five trading days. The price has moved back within the high low boundaries that existed from November 26 through December 7 between 1.27105 and 1.28533. Sellers this morning against the 100 hour moving average (and 38.2% of the December trading range) at 1.2806 is a tilt to the downside at least in the short term. Having said that, there still is work to do for the sellers.
- They need to stay below the resistance at 1.2806
- The 50% midpoint at 1.2766 need to be broken
- The 200 hour moving average at 1.27497 also needs to be broken
Conversely, a move back above the 100 hour moving average would have traders eyeing the 1.2828 to 1.28362 area and the 1.28533 level for more bullish bias breaks. Extend above those levels and a retest of the high near 1.28355 would be in traders view.