The USDCAD moved above the 38.2% retracement of the move down from the May 2023 high at 1.3306.
On the hourly chart, the buyers have been trending the pair to the upside over the last 2 days with little in the way of corrections.
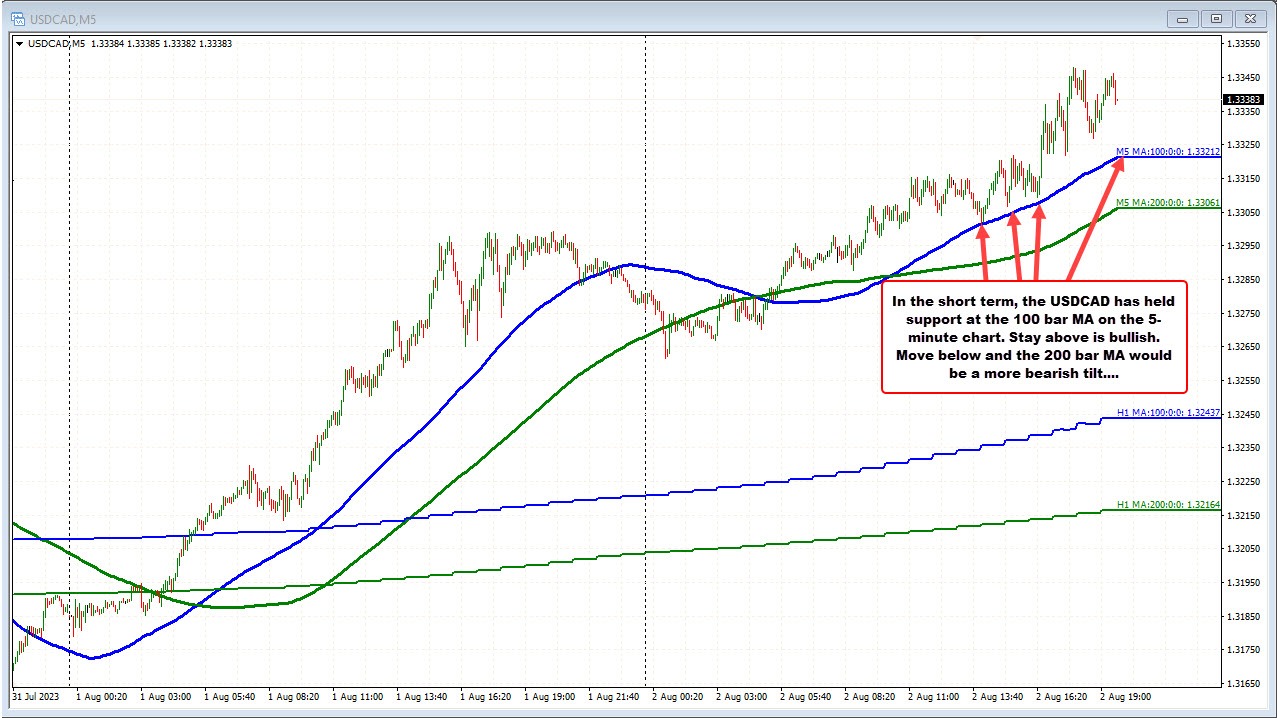
On the 5-minute chart, after correcting lower into the Asian session, the price of the USDCAD started to trend to the upside and use its 100-bar moving average on the chart as a support level to propel the pair to the upside (see blue line on the chart below).
In this video, I analyze the technicals driving the USDCAD by transitioning from the daily chart, to the hourly chart, to the 5-minute chart to paint the bullish technical picture. I also define where that technical picture starts to tilt more in favor of the sellers.