The USDCAD extended above a key swing area between 1.3924 and 1.3937 (see post yesterday), pushing toward the next upside target zone between 1.3971 and 1.3994. The rally reached a high of 1.3966—just short of that next resistance band—before stalling and rotating back to the downside.
By the close, the price had fallen back below the 1.3924–1.3937 swing area, and selling pressure has continued into today. The pair has now broken below the 100-hour moving average at 1.38947 and the 61.8% retracement of the move down from the November 2025 high to the January low, which comes in at 1.3888. That break shifts the near-term bias back to the downside.
Those two levels—the 100-hour MA (1.38947) and the 61.8% retracement (1.3888)—now act as risk-defining resistance. As long as the price stays below, sellers remain in control and further downside probing is likely following last week’s sharp rally.
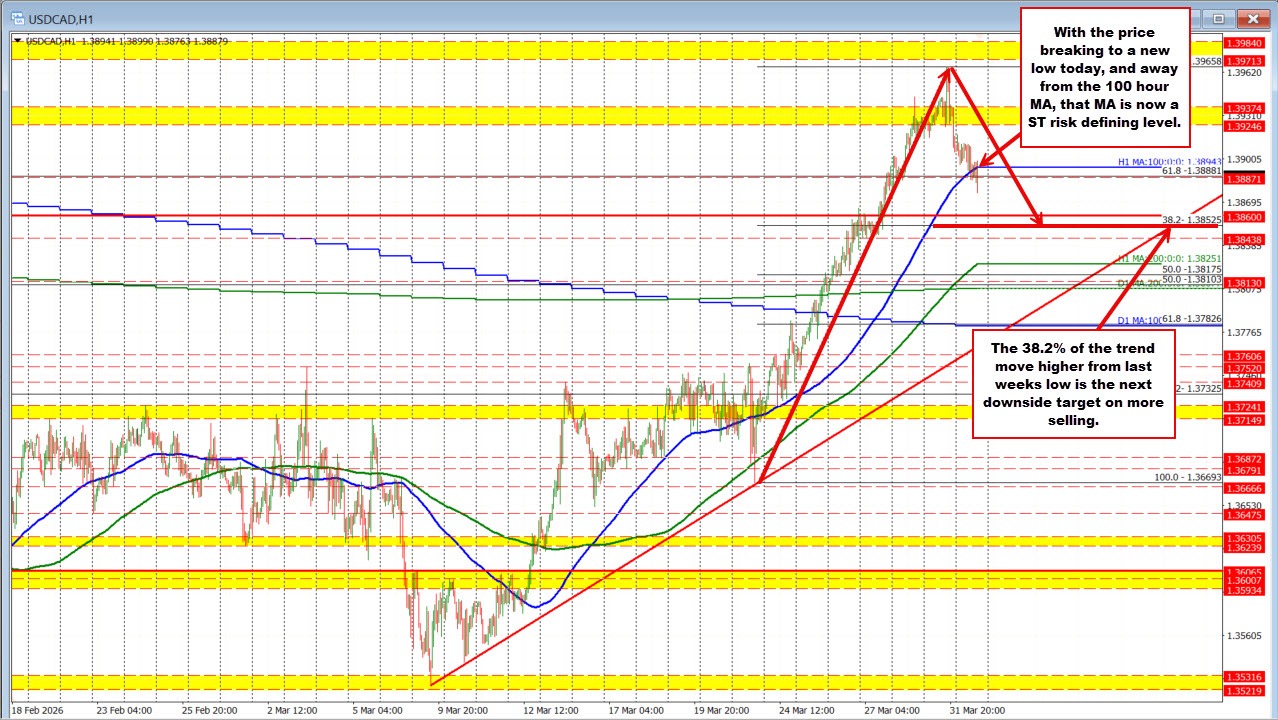
On the downside, the next key target comes in at the 38.2% retracement of the move up from last week’s low at 1.3852. A move below that level, followed by a break of the nearby swing level at 1.3844, would give sellers more confidence and open the door for a deeper correction.
Conversely, if the 1.3852–1.3844 support zone holds, the current move lower can be viewed as a plain-vanilla correction within the broader bullish trend.
Key levels to watch:
- Resistance: 1.3888 (61.8%), 1.38947 (100-hour MA)
- Support: 1.3852 (38.2%), 1.3844 (swing level)


