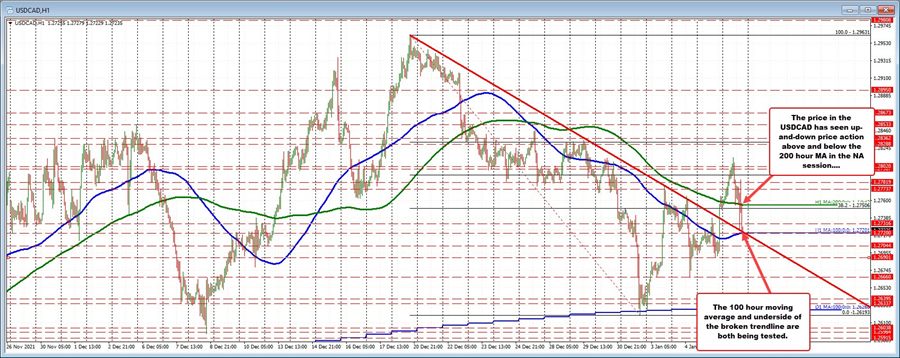
The USDCAD has seen up-and-down volatility in the North American session.
The pair initially fell below its 200 hour moving average and quickly moved down to test the underside of the broken trendline (the trendline was broken yesterday). The price found support against that level and quickly moved back higher reaching back above its 200 hour moving average at 1.2754 on its way to 1.27852.
Since then, the price has once again moved back below its 200 hour moving average and is currently retesting the broken trendline and the rising 100 hour moving average near 1.2720.
Once again, the buyers and sellers will line up against the level and battle it out.
Will the dip buyers once again when out and pushed price back toward the 200 hour moving average?
Will the sellers get below both technical levels and open the door for further downside momentum?
Those are the questions that need to be answered at key technical levels. This is a key technical level for the USDCAD.