Yesterday, the US100 sold off into the close as the Fed came out a bit more hawkish than expected. In fact, not only the statement contained a line that hinted to a pushback against the March cut, but also Fed Chair Powell doubled down saying that a March cut was not their base case. All of the above though is conditional to the data as they just want to see inflation continuing to slow towards their target. If we get some weak reports, especially on the labour market side, then the Fed will have more confidence in delivering a rate cut in March.
US100 Technical Analysis – Daily Timeframe
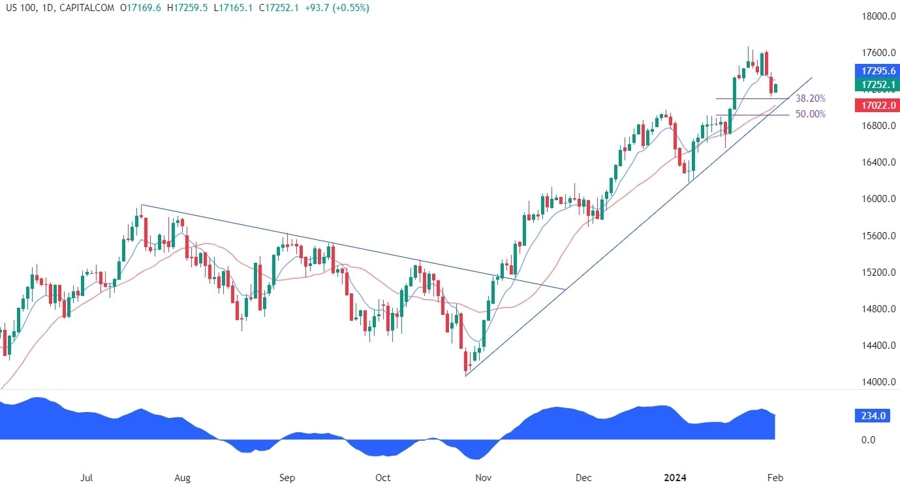
On the daily chart, we can see that the US100 pulled back into a key support zone around the trendline where we can also find the confluence of the Fibonacci retracement levels and the red 21 moving average. This is where we can expect the buyers to start piling in with a defined risk below the trendline to position for a rally into new highs. The sellers, on the other hand, will want to see the price breaking lower to invalidate the bullish setup and start looking for new lower lows with the first target standing around the 16190 level.
US100 Technical Analysis – 4 hour Timeframe
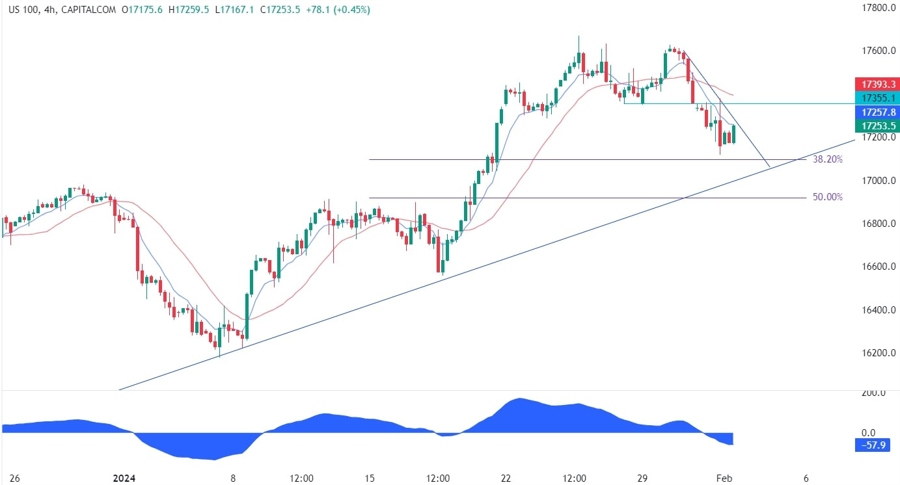
On the 4 hour chart, we can see that the price recently broke below the 17356 level creating a new lower low, retested the level and continued lower. The trend on this timeframe is currently downwards, which is also depicted by the moving averages being crossed to the downside. The sellers will likely lean on the downward minor trendline to position for a break below the major trendline, while the buyers will want to see the price breaking above the minor trendline to switch the bias to bullish and start looking for new higher highs.
US100 Technical Analysis – 1 hour Timeframe
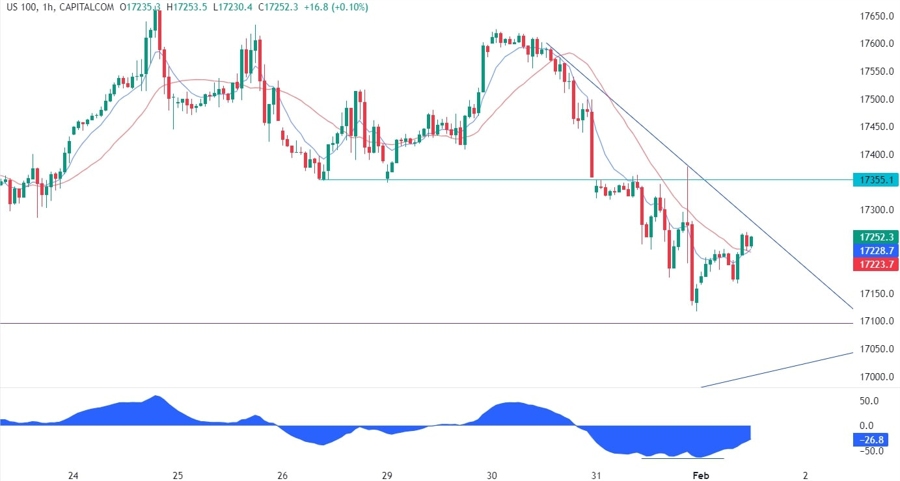
On the 1 hour chart, we can see more closely the recent price action and we can notice that the price diverged with the MACD right around the key support zone. This is generally a sign of weakening momentum often followed by pullbacks or reversals. In this case, it might be another bullish confluence for the buyers, which should give them even more conviction for a continuation of the major uptrend. The sellers, on the other hand, will need the price to break through the major trendline to invalidate the bullish setup and continue to target new lows.
Upcoming Events
Today we get the latest US Jobless Claims figures and the ISM Manufacturing PMI. Tomorrow, we conclude the week with the US NFP report.
