Order flow perspective as price tests a key downside level
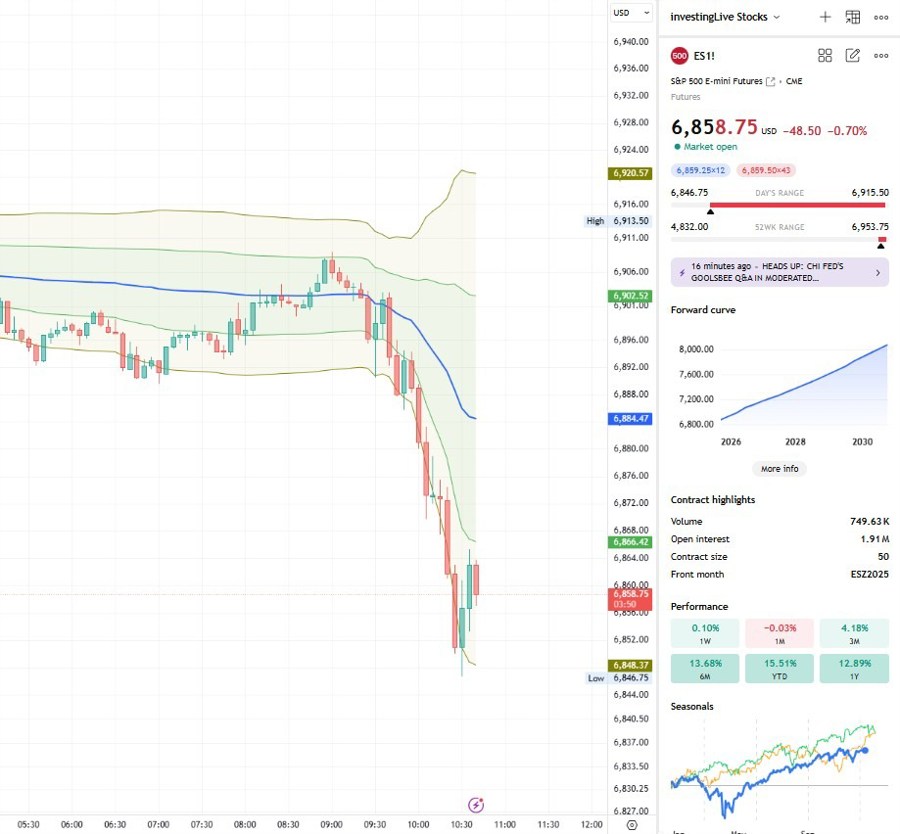
As market rotation may be intensifying and silver, the new black in metals (for quite some time now) skyrockets to a new high (don't forget my long term target for silver), I wanted to access investingLive's orderFlow Intel to see if the early selling today was intense under the hood. At the time of analysis, the S&P 500 futures are trading near 6,858, which is an important reference point for both short term traders and swing focused investors. This level represents yesterday’s value area low, and it is also a naked level, meaning it has not been fully tested since it was formed. These areas often attract attention because they can act as temporary stopping points, reaction zones, or decision points for the next directional move.
From a pure chart perspective, the downside move over the last several range bars is obvious. What order flow analysis helps us answer is a deeper question: is this move driven by aggressive selling, or is it more of a controlled grind lower with two sided participation?
What the order flow is telling us
Our order flow analysis shows that sellers remain in control, but this is not a panic selloff.
Buy and sell activity remains relatively balanced, even as price pushes lower. This suggests the market is still trading in a two sided manner, rather than experiencing forced liquidation.
Despite that balance, sellers are consistently the more aggressive side, which is why price continues to drift lower.
Importantly, we do not yet see strong evidence that buyers are stepping in aggressively at the lows. This means downside pressure has eased slightly at times, but it has not clearly reversed.
In simple terms, sellers are pressing, but they are not slamming the market. Buyers are present, but so far they are reactive rather than proactive.
Key levels that matter now
These are the reference points traders and investors should keep in mind:
6,858: Yesterday’s value area low and current test zone. This is the main decision point.
6,869: Yesterday’s point of control. Often a natural first upside magnet if price stabilizes.
6,885 to 6,891: Today’s value area low and VWAP zone. Reclaiming this area would meaningfully improve the short term bullish case.
As long as price remains below today’s value area and VWAP, the near term structure stays bearish to neutral, even if we see short lived bounces.
Scenarios to consider
Stabilization or bounce scenario
If price holds above 6,858 and order flow starts to show less selling pressure, a tactical bounce toward 6,869 and potentially the lower edge of today’s value area becomes more likely. This would be a corrective move inside a still fragile structure, not an automatic trend reversal.
Continuation lower scenario
If price accepts below 6,858 and selling pressure remains steady, the market is likely searching for the next lower liquidity pocket. That would keep downside risk elevated and favor patience for dip buyers.
OrderFlow Intel takeaway
OrderFlow Intel is designed to give decision support, not predictions carved in stone. Right now, it tells us that sellers are still in control, but the market is approaching a level where reactions often occur. Traders should focus less on guessing direction and more on how price behaves at 6,858, and whether selling pressure intensifies or fades.
OrderFlow Intel bias score: -4
This reflects a bearish bias with moderate confidence, balanced by the fact that price is testing a statistically important support zone.
Trade at your own risk.


