The weaker jobs reports out of both Canada and the U.S. last week have raised expectations that the Fed and the Bank of Canada could each deliver a rate cut when they meet next week. Both central banks announce on Wednesday, with the BoC decision at 9:45 AM ET, followed by the FOMC at 2 PM ET.
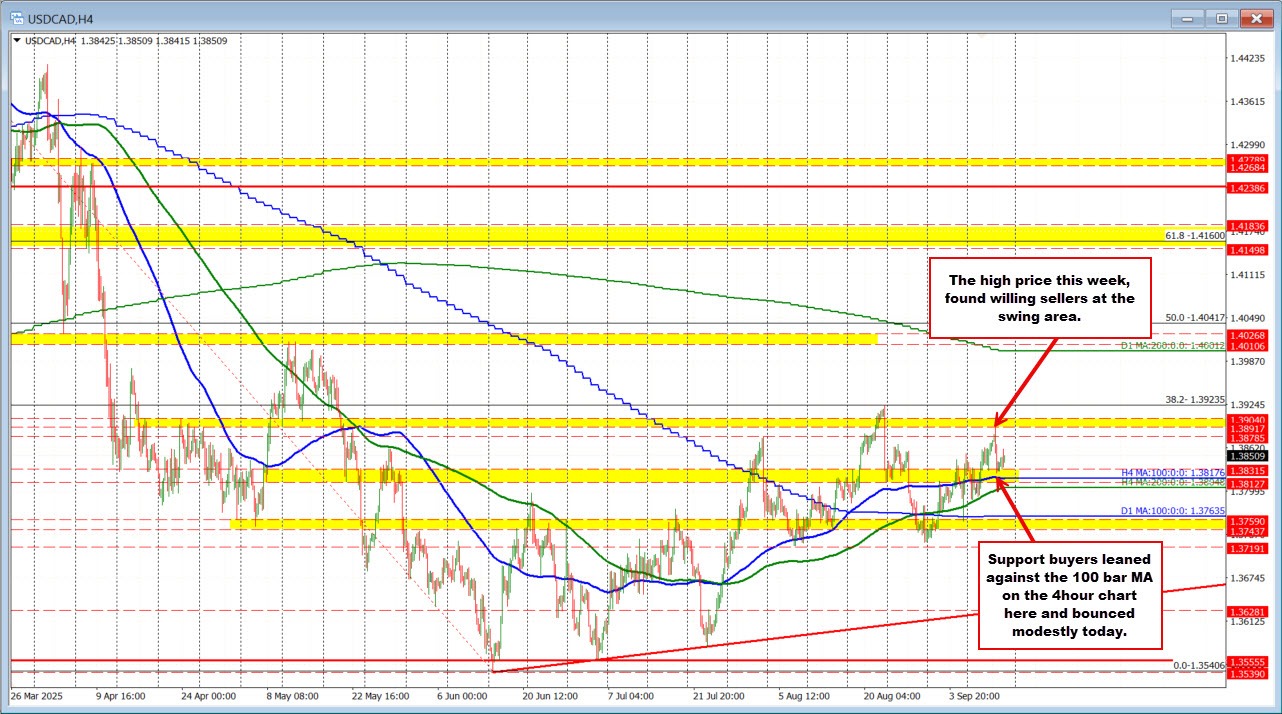
For USDCAD, the pair is little changed on the week after early declines at the start the week found support at the 200-bar moving average on the 4-hour chart (1.38048, green line). That bounce carried the price up to the bottom of a key swing area between 1.38917 and 1.3904, where resistance capped the upside. Since then, the pair has rotated back down, testing the 100-bar moving average on the 4-hour chart at 1.38176, where buyers again leaned against support.
Yesterday in my post I spoke of the critical importance of that 100 bar moving average for traders when I wrote:
- On the downside, the decline has carried the pair back toward another swing area between 1.3812 and 1.3831. This zone is now joined by the rising 100-bar moving average, currently at 1.3195, making it a critical short-term pivot for traders.
Heading into the weekly close, the technical picture is defined by these boundaries: resistance at 1.38917–1.3904 and support at the 100-bar moving average on the 4 hour chart (at 1.38176). A break below the 100-bar and the rising 200-bar moving average (1.38048) would shift bias lower, opening the door to the 100-day moving average at 1.37635. On the topside, a push through 1.38917–1.3904 would target the 38.2% retracement and the August high at 1.39235.
With support holding against the moving averages, buyers maintain a modest short-term advantage, though the range defines the battle lines heading into next week’s central bank decisions.
🔑 Technical Map – USDCAD
Support: 1.38176 (100-bar MA, 4H) → 1.38048 (200-bar MA, 4H) → 1.37635 (100-day MA).
Resistance: 1.38917–1.3904 (swing area) → 1.39235 (38.2% retracement & August high).
Bias: Modest upside as long as price holds above 100/200 bar MAs; break lower shifts momentum bearish.


