The NZDUSD and AUDUSD fell sharply last week, with the help of the stock liquidation on Friday. That led to risk off flows for the currencies and a flight into the dollar. Both the NZD and the AUD, however, are rallying today (USD moving lower) on the opposite risk-on flow, but at different speeds. For the USDCAD, it too saw CAD selling and dollar buying last week, that continued yesterday. Like the AUD and the NZD, the CAD is seeing a bit more buying today (lower USDCAD).
So what has the corrections in each, done from a technical perspective? That is has the short term bias shifted putting into question the recent run higher in the USD?
NZDUSD Technical Review:
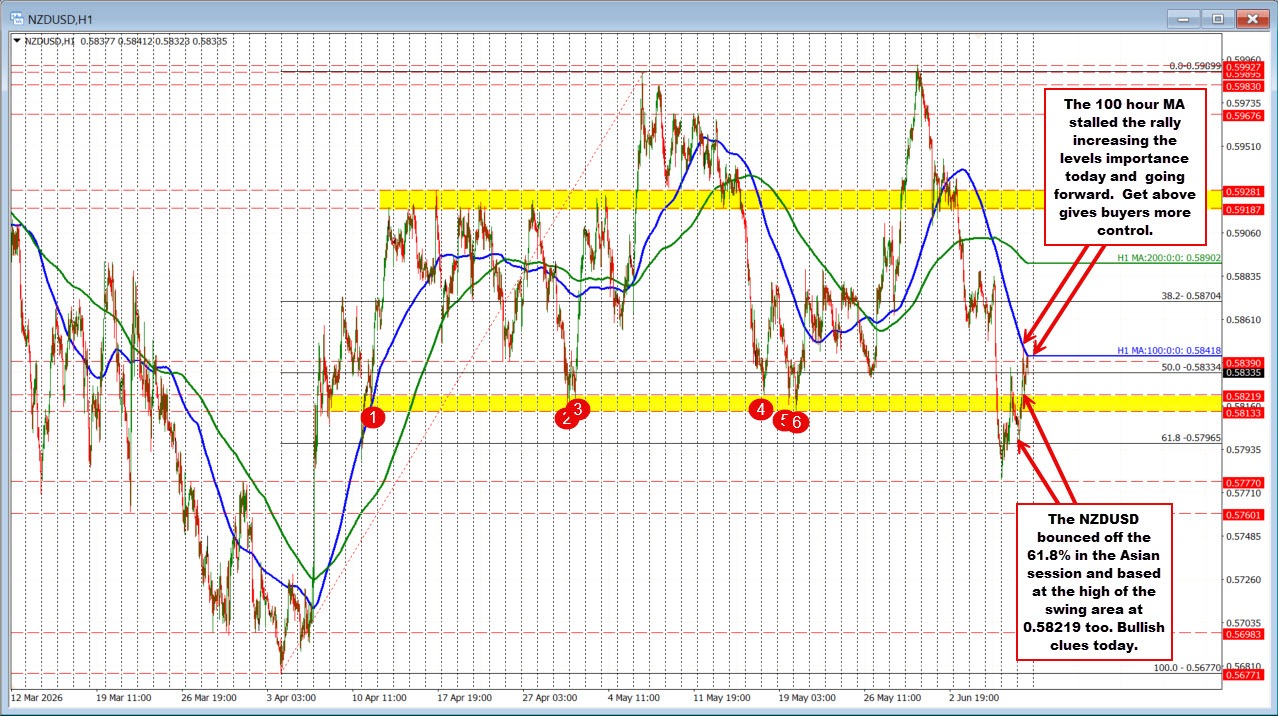
For the NZDUSD, the price action has offered several encouraging technical clues for buyers. The first came during the early Asian session when the pair tested support near the 61.8% retracement of the rally from the April low to the May high at 0.5796, a level that also coincided with the psychologically important 0.5800 area. The session low reached 0.5800, and the successful defense of that support gave buyers the confidence to step back in.
That rebound helped drive the pair above a key swing area between 0.5813 and 0.5822, another bullish development. Breaking above that zone shifted the short-term bias higher and opened the door for a move toward the next technical hurdle: the falling 100-hour moving average.
The rally ultimately stalled at that moving average as sellers leaned against the level. However, the subsequent pullback provided another positive signal. Rather than falling back below the prior breakout zone, the correction found willing buyers near the top of the swing area at 0.5822, turning former resistance into support. The pair has since worked its way back toward the 100-hour moving average, setting up an important technical battle.
Going forward, the 100-hour moving average remains the key barometer for both buyers and sellers. If the risk-on tone in the North American session continues and the pair can break and stay above that moving average, it would strengthen the bullish case and signal that buyers are gaining greater control. Conversely, failure to break above the moving average could keep sellers in charge and lead to another test of the 0.5813–0.5822 support zone.
For now, the technical roadmap is well defined. Support has held where buyers needed it to hold, resistance has been identified, and the battle lines are clearly drawn around the 100-hour moving average. The next break should provide an important clue for the pair's near-term direction.
AUDUSD Technical Review:
For the AUDUSD, the recovery effort has been noticeably less impressive than what we have seen in the NZDUSD. Nevertheless, there have been some positive developments from a technical perspective.
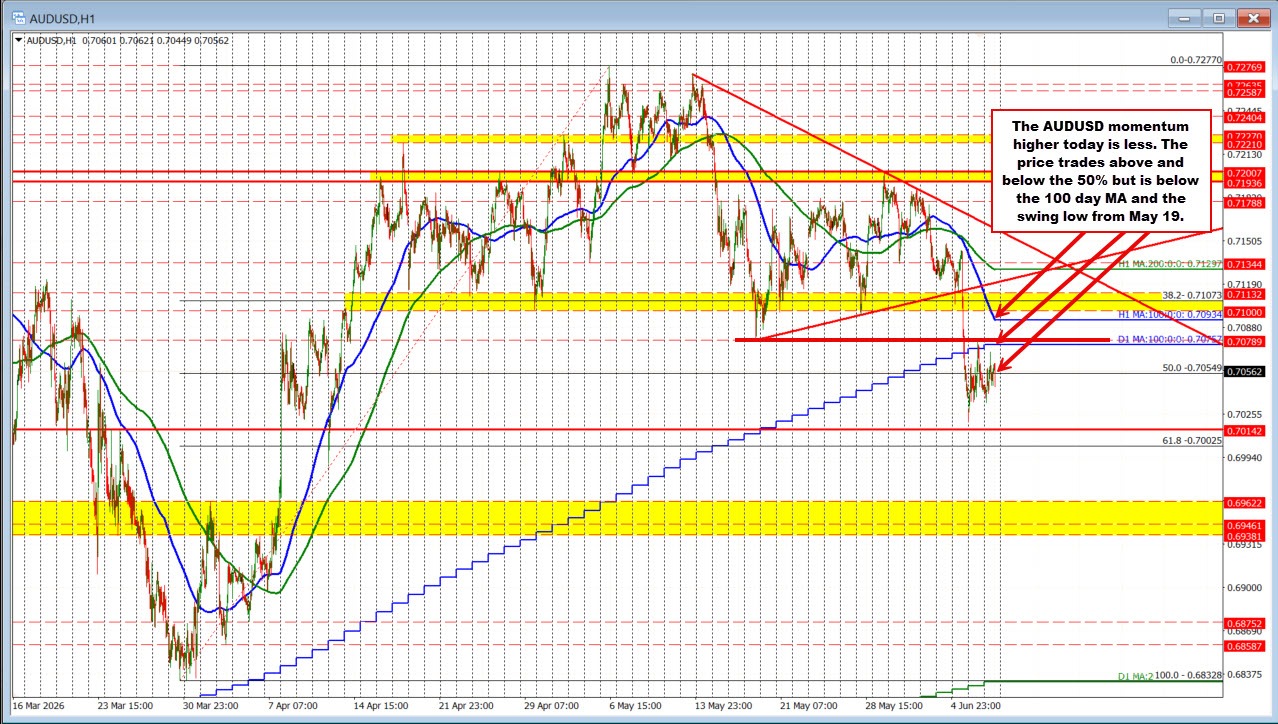
The pair has managed to move back above the 50% retracement of the rally from the late-March low to the early-May high, which comes in at 0.7055. However, unlike the NZDUSD, the price is struggling to build momentum above that level and has spent the early North American session trading back and forth around the midpoint.
As a result, buyers still have considerable work to do if they want to demonstrate that yesterday's low near 0.7018 was a meaningful bottom. The next key hurdle comes at the 100-day moving average at 0.7076. Recall that during yesterday's trading, the price briefly pushed above that moving average but failed to sustain the break as sellers leaned against a swing low from May 19 at 0.7079. The inability to hold above those levels encouraged renewed selling pressure and sent the pair back lower.
As such, buyers need to reclaim and hold above both the 100-day moving average (0.7076) and the May 19 swing low (0.7079) to improve the technical outlook. If they can do that, attention would shift toward the falling 100-hour moving average at 0.7093, followed by the next resistance zone between 0.7100 and 0.7113.
For now, the AUDUSD faces a more challenging technical roadmap than the NZDUSD. While the move back above the 50% retracement is a constructive step, the pair remains surrounded by several layers of overhead resistance. Traders will continue to watch the 0.7055 midpoint level for near-term directional clues. If the price cannot establish itself above that level, it would suggest that buyers are still struggling to gain meaningful control and could leave the door open for another move back toward recent lows.
USDCAD Technical Review:
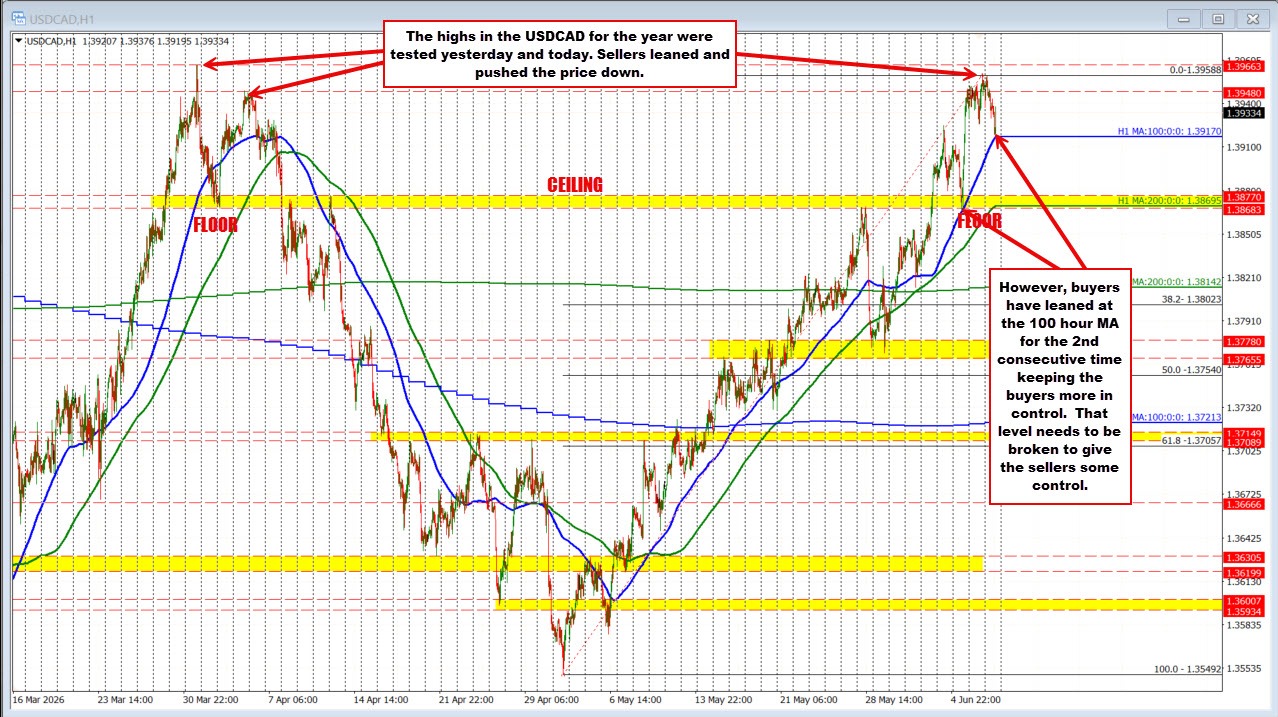
For the USDCAD, the pair retested yesterday's high during the early Asian-Pacific session and found willing sellers near 1.3959. That resistance area sits within a broader zone defined by swing highs from March and early April between 1.3948 and 1.3966. The inability to break above the 2026 high at 1.3966 gave sellers the green light to push the pair lower.
The subsequent decline has brought the price down toward its 100-hour moving average at 1.3917, a level that has attracted buyers on multiple occasions. Today's low reached 1.3920, just above the moving average, before rebounding back toward the current level near 1.3935.
The fact that buyers stepped in once again at the 100-hour moving average increases its importance as a near-term risk-defining level. There is also recent history supporting its significance. Last Friday, the pair found support and rebounded from essentially the same moving average. When a technical level repeatedly attracts buyers and sellers, traders tend to place greater emphasis on it when defining both risk and directional bias.
As a result, the battle lines are becoming more clearly defined. A move below the 100-hour moving average would tilt the bias back to the downside and have traders targeting the 200-hour moving average at 1.3870. That moving average resides within an important swing area between 1.3868 and 1.3877, making it the next key downside target.
On the other hand, as long as the price remains above the 100-hour moving average, it is difficult to argue that sellers have regained control. Instead, the pair remains trapped between well-defined technical boundaries: resistance at the 2026 high of 1.3966 and support at the rising 100-hour moving average near 1.3917. Until one of those levels gives way, traders are likely to view the current price action as a battle for control rather than a decisive change in trend.


