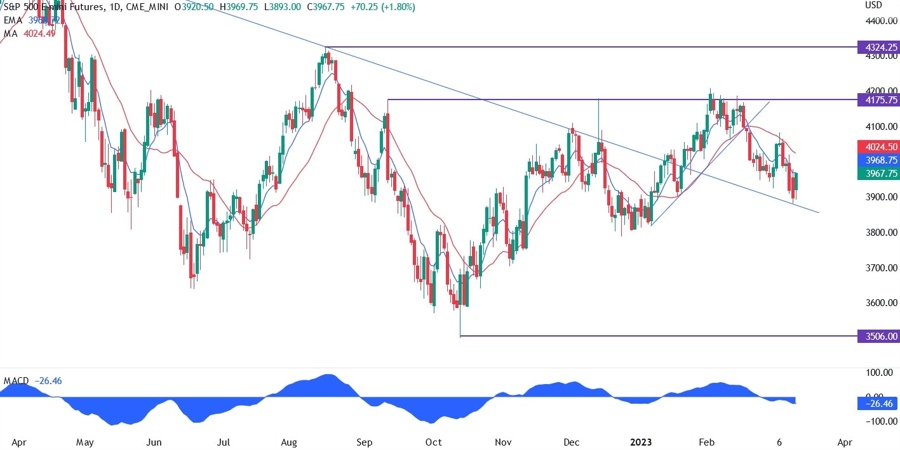
On the daily chart below, we can see that the price has finally tested the broken trendline near the 3880 level and bounced from there. The recent selloff came from the failure of the Silicon Valley Bank which sent the markets into risk off as the fear of contagion spread fast.
This weekend the Treasury and the Fed worked on a solution to protect the depositors and calm the markets and they came up with a new emergency lending facility that gives the banks the possibility to convert their long term securities at the original value instead of being marked to market. This gave the market a boost as soon as the futures market reopened, and we saw a rally all night long.
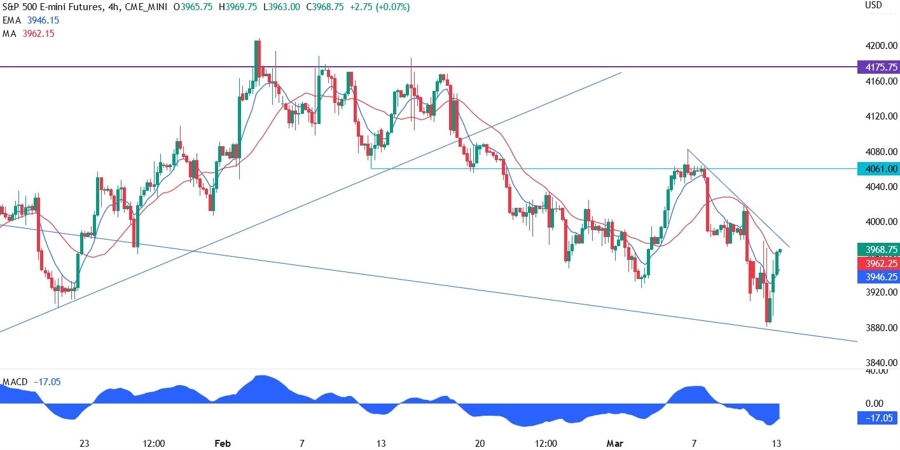
In the 4 hour chart below, we can see that the market is approaching a trendline that may act as resistance coupled with the red long period moving average. The sellers will want to defend this level and wait for the CPI report to come out. The market is now pricing in a higher chance of a 25 bps hike and completely priced out the 50 bps move.
This happened because the market expects the Fed to be less aggressive in light of the recent events. Nonetheless, a hot CPI report should raise the odds of 50 bps up again and a really hot one may even give a higher chance of the bigger move. So, all eyes on the data tomorrow.
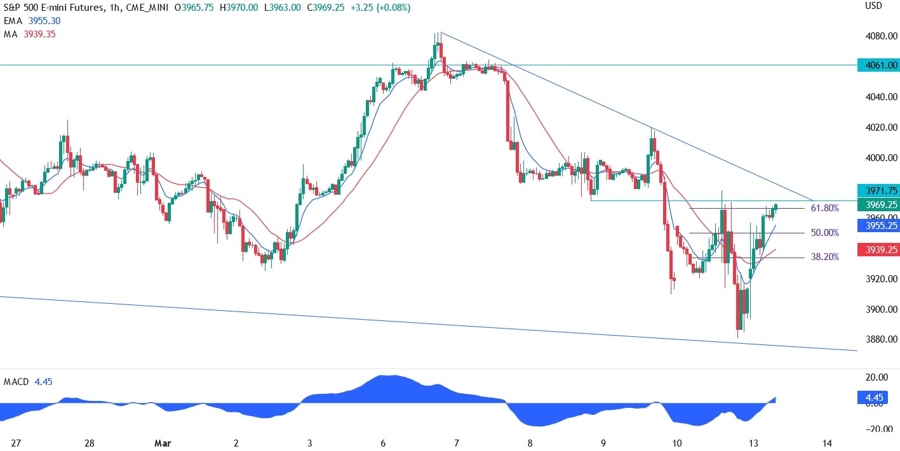
In the 1 hour chart below, we can see that the sellers have the confluence of a previous swing level resistance, the 61.8% Fibonacci retracement level and the trendline all in the same zone. This should be hard to crack for the buyers at the first try as the sellers will want to defend the level until the CPI.
A break above the trendline would be a bad omen for the sellers and if the CPI report misses expectations, then the buyers will gain full control and start a rally towards 4061 and possibly higher.