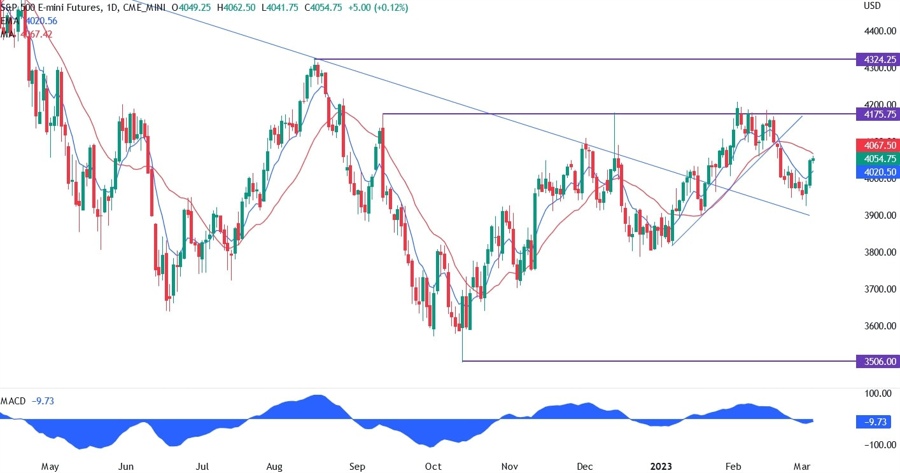
On the daily chart below, we can see that the price was slowly approaching the major downward trendline for a retest or a break lower. For now, seems like we’ve got a retest as the price rallied last Friday.
The last leg of the rally came after the ISM Services PMI beat expectations, which left the bears scratching their heads as another hot report should have been bearish for the market. The price is now at the red long period moving average which will act as resistance and will be the last line of defence for the sellers.
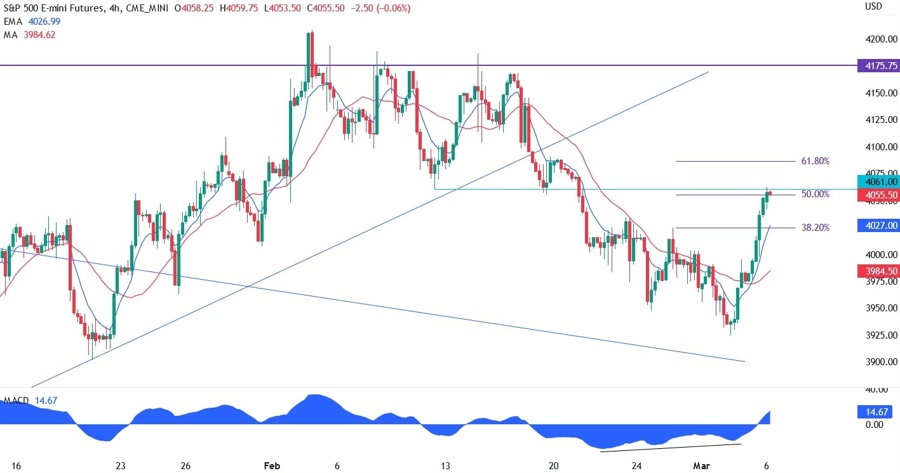
In the 4 hour chart below, we can see that the price has rallied into a previous swing level which will act as resistance and the 50% Fibonacci retracement level of the entire bearish move since mid-February.
The price is also a bit overextended as depicted by the distance between the last candlestick and the blue short period moving average. Generally, the price either consolidates a bit or pulls back before the next move. The moving averages on this timeframe have crossed to the upside so they will act as support for the buyers.
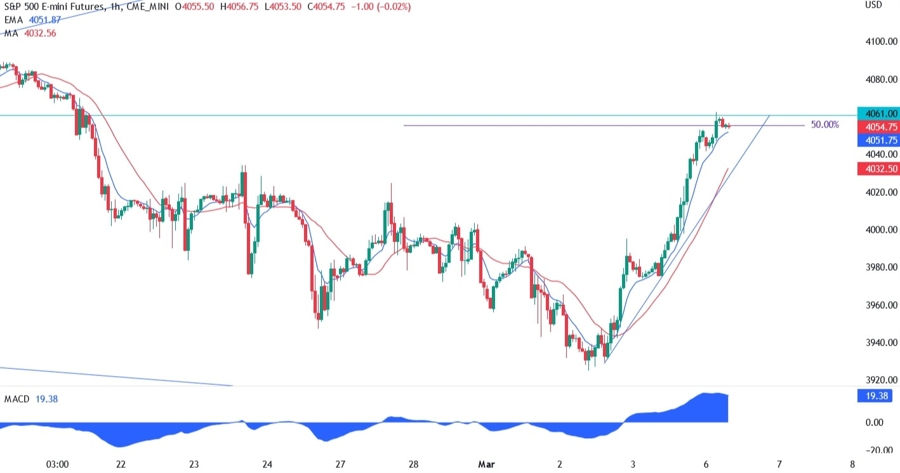
In the 1 hour chart below, we can see more closely the parabolic rally on Friday. The next support for the buyers will be the red long period moving average and the trendline.
A break below the trendline and a cross to the downside of the moving averages will be a bearish signal and the sellers may jump in again as they will look to fade the reaction out of the ISM Services PMI report. The buyers, on the other hand, will need a break above the resistance at 4061 to remain in control and target higher highs with another possible test of the 4175 level.