The S&P index pushed higher yesterday, extending further away from its 100-hour moving average (currently at 6555.60) and reclaiming key technical ground in the process. The rally also moved the price above the 38.2% retracement of the decline from the late-January all-time high, which comes in at 6578.70. That break was a positive signal for buyers, but momentum stalled right near a downward sloping trendline at the close, keeping a lid on further upside and setting up a decision point for today.
That decision has started to unfold premarket with declines in the futures. On the open today, sellers stepped in and pushed the index even lower, driving the price down through the 100-hour moving average. However, the downside momentum has faded somewhat, with the price now back above that moving average, although still holding below the 38.2% retracement at 6578.70. That leaves the market in a familiar spot—caught between key support and resistance, with neither side fully in control.
What makes this setup more precarious is the macro backdrop. With escalating tensions tied to the Iran conflict and the clock ticking toward the 8 PM deadline regarding the Strait of Hormuz, headline risk is elevated. That uncertainty is translating directly into two-way trading risk.
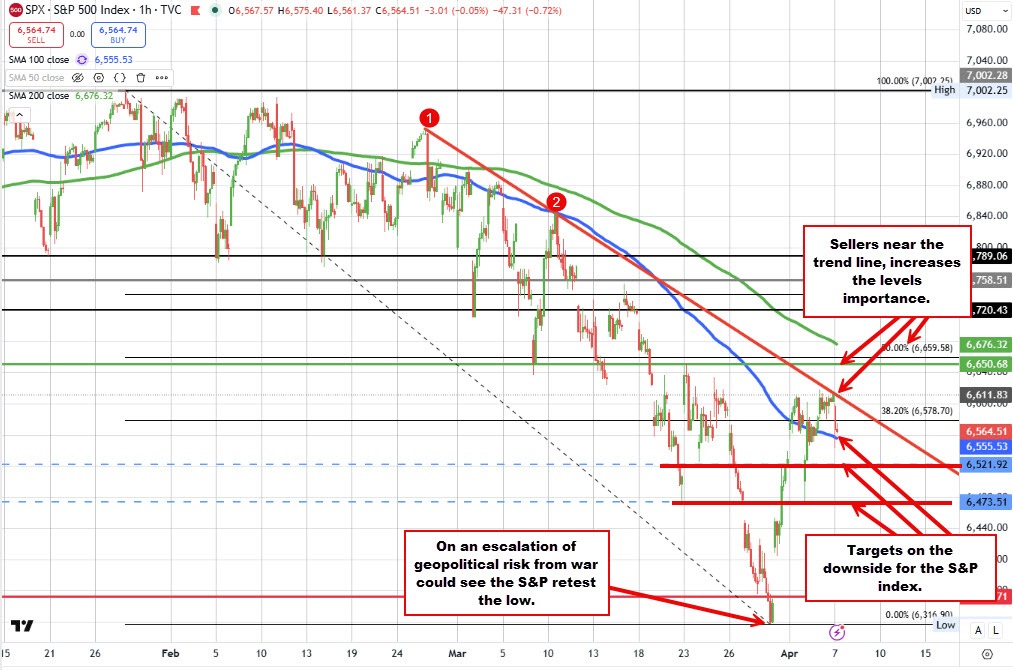
If tensions escalate further or a deal fails to materialize, the market could tilt lower, with initial downside targets near 6521, followed by 6473 (swing low levels). A deeper move cannot be ruled out IF oil skyrockets and stays elevated, with the March 30 low at 6316 sitting as a more distant but relevant downside reference point.
On the other hand, if there is a delay in escalation or renewed optimism around a ceasefire, buyers could reassert control (with oil moving lower to provide the backdrop). A move above the trendline resistance near 6613 would be the first step, followed by a test of the key 200-day moving average at 6650.68 and the 50% retracement of the 2026 decline not far from that moving average at 6659.58. A break above that cluster would strengthen the bullish bias and signal a more meaningful recovery.
For now, the market remains range-bound with clearly defined levels. Above the 100-hour moving average keeps buyers in the game. Below it tilts the bias back to sellers. But ultimately, the next directional move may depend less on the charts—and more on the headlines


