The miss in the ADP report yesterday gave the market a bit of relief after a series of strong economic data like Jobless Claims, ISM Manufacturing PMI and Job Openings. The ISM services PMI has also printed bang on expectations, and coupled with the other reports, supports the soft-landing narrative. Moreover, the market was also helped by the fall in Treasury yields and Oil prices which might calm the fears of another inflationary wave. Technically, we are also around key levels and the selloff after the more hawkish than expected FOMC dot plot might need at least a correction.
S&P 500 Technical Analysis – Daily Timeframe
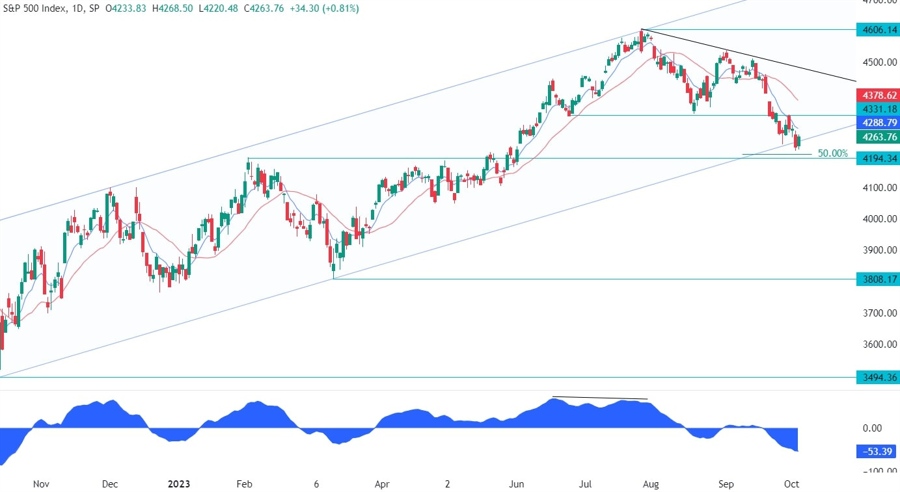
On the daily chart, we can see that the S&P 500 bounced again on the key trendline near the 50% Fibonacci retracement level of the entire rally since March. This is where the buyers are likely to pile in with a defined risk below the low to position for a rally into the downward trendline around the 4430 level. The sellers, on the other hand, will want to see the price continuing lower and breaking below the key support around the 4194 level to position for a bigger drop into the 3808 level.
S&P 500 Technical Analysis – 4 hour Timeframe

On the 4 hour chart, we can see that the latest leg lower diverged with the MACD which is generally a sign of weakening momentum often followed by pullbacks or reversals. In this case, the sellers are likely to lean on the red 21 moving average and the 4331 resistance where we have also the 38.2% Fibonacci retracement level for confluence. If the price breaks above the 4331 resistance, the buyers will gain even more conviction and likely take the S&P 500 into the black downward trendline.
S&P 500 Technical Analysis – 1 hour Timeframe

On the 1 hour chart, we can see more closely the bearish setup with the trendline adding an extra layer of confluence to the 4-hour 21 moving average. The sellers might want to split their orders between the trendline and the 4331 resistance as there’s a high chance that both work out depending on the data in the next couple of days. The buyers, on the other hand, will be focused on the 4331 resistance as a break of that level will open the door for higher prices.
Upcoming Events
Today we have the Jobless Claims report, which continues to show a solid labour market and given the reaction to the miss in the ADP yesterday, we can expect a rally in case of a miss and a drop in case of a beat. Tomorrow, it will be the time for the NFP report which is the only one the Fed will see before its next rate decision.
See the video below:


