Last week, the market remained under pressure as the more hawkish than expected FOMC dot plot was still fresh in everyone's mind. The economic data continues to support the soft-landing narrative with Jobless Claims showing a solid labour market and Core PCE trending downwards. The last day of the week, we got a small bounce across the board as the market took a breather after the heavy selloff after the FOMC meeting. We will see if it was just a pullback or the start of a new rally.
S&P 500 Technical Analysis – Daily Timeframe
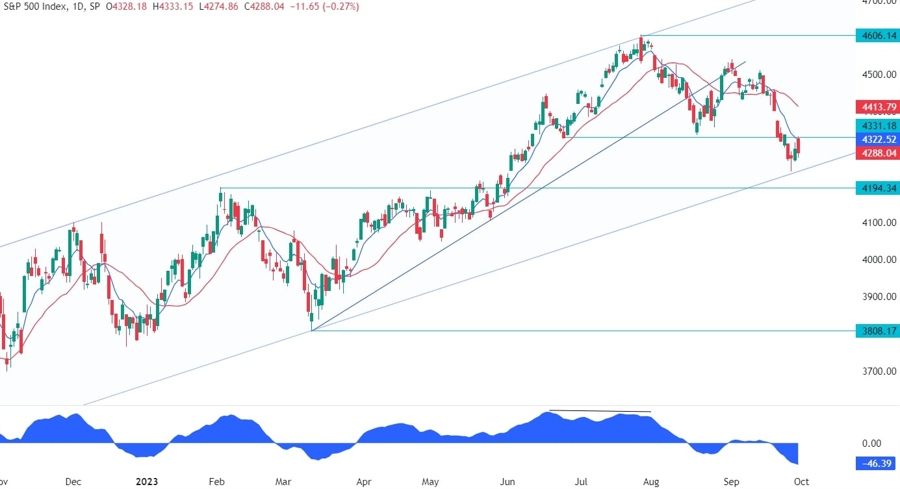
On the daily chart, we can see that the S&P 500 bounced almost perfectly on a key trendline, which is also the lower bound of the rising channel. The price rallied into the previous support turned resistance and the blue 8 moving average where it found strong sellers and fell into the close. The question now is: was this just a pullback or the start of a new rally?
S&P 500 Technical Analysis – 4 hour Timeframe
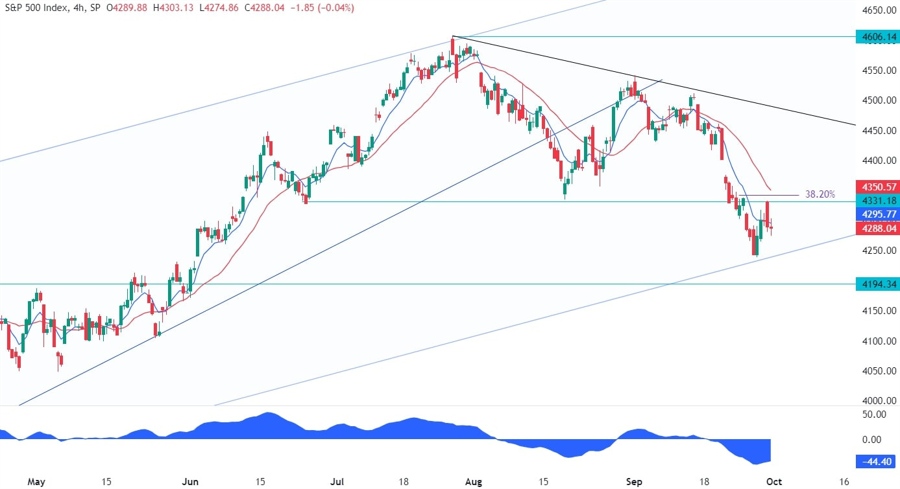
On the 4 hour chart, we can see more closely the resistance around the 4331 level where we had the confluence of the 38.2% Fibonacci retracement level and the red 21 moving average. If the price breaks above this resistance, then we will likely see a rally into the downward trendline around the 4450 level. A break below the key upward trendline, on the other hand, will open the door for much lower prices.
S&P 500 Technical Analysis – 1 hour Timeframe
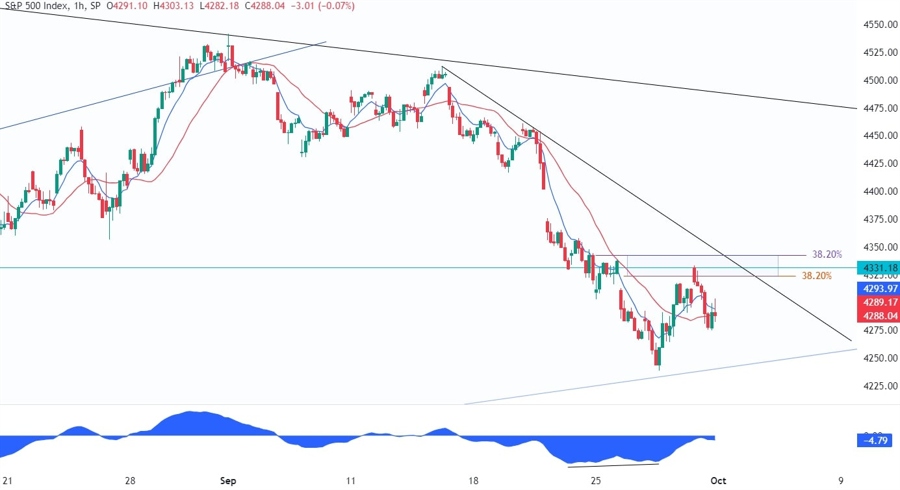
On the 1 hour chart, we can see that we had a divergence with the MACD right into the key trendline, which is generally a sign of weakening momentum often followed by pullbacks or reversals. The price indeed pulled back into the resistance zone where we can find even more confluence on this timeframe as we have the downward trendline and another 38.2% Fibonacci retracement level. If the price pulls back again into the resistance, the sellers are likely to step in with a defined risk above the trendline to target a break below the key upward trendline. The buyers, on the other hand, will want to see the price breaking higher to pile in and position for a rally into the downward trendline around the 4450 level.
Upcoming Events
This week we have many key economic releases that will culminate in the NFP report on Friday. Today, we will see the latest ISM Manufacturing PMI. Tomorrow, we will have the Job Openings data which led to a strong rally the last time as the big miss was interpreted as a good thing due to less labour market tightness and less hawkish Fed. On Wednesday, it will be the time for the ADP report and the ISM Services PMI. On Thursday, we will see the Jobless Claims data, which continues to show a solid labour market. Finally on Friday, it will be the time for the NFP report which is the only one the Fed will see before its next rate decision.
See also the video below


