Fundamental Overview
This week has been all about tariffs. On Monday we opened with a big gap lower as Trump followed through with his tariffs threats and imposed them on Canada, Mexico and China over the weekend.
As it’s been the case for previous tariffs actions though, the market started to cautiously fade the reaction in expectation of some kind of a deal. That’s exactly what happened as we got the news on Monday afternoon that the tariffs on Mexico were paused for 30 days after positive negotiations.
The market bounced back immediately, and the bulls started to build their positions with more conviction. There’s still the question with China but given that China’s response has been very soft and we haven’t got any negative news yet, the market is keeping with the optimism.
The focus now switched to the US NFP report tomorrow. The labour market data throughout January has been good, so we might see an overall good NFP report as well. The focus remains on inflation for the Fed, so even if we get a strong NFP, it shouldn’t change the Fed’s stance and two rate cuts by the end of the year will continue to remain the baseline.
S&P 500 Technical Analysis – Daily Timeframe
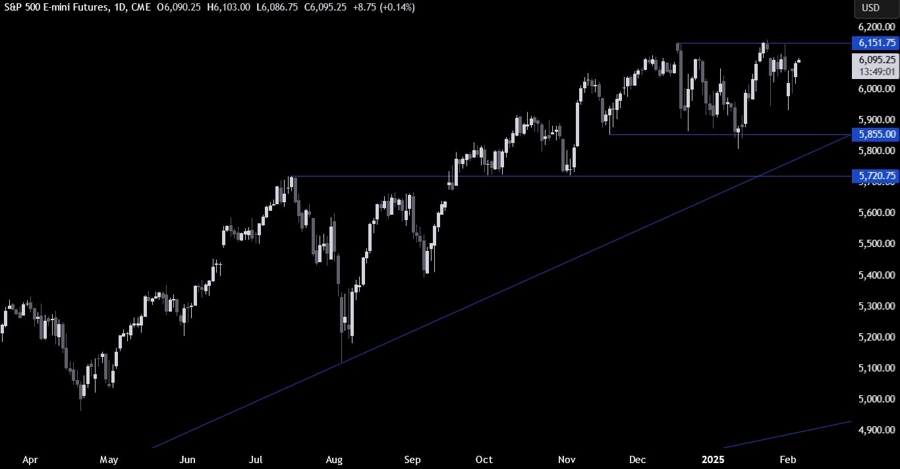
On the daily chart, we can see that the S&P 500 has been stuck in a big range for three months now. The market participants will continue to play the range until we get a breakout on either side as that will likely increase the momentum and give us the next impulse.
S&P 500 Technical Analysis – 4 hour Timeframe
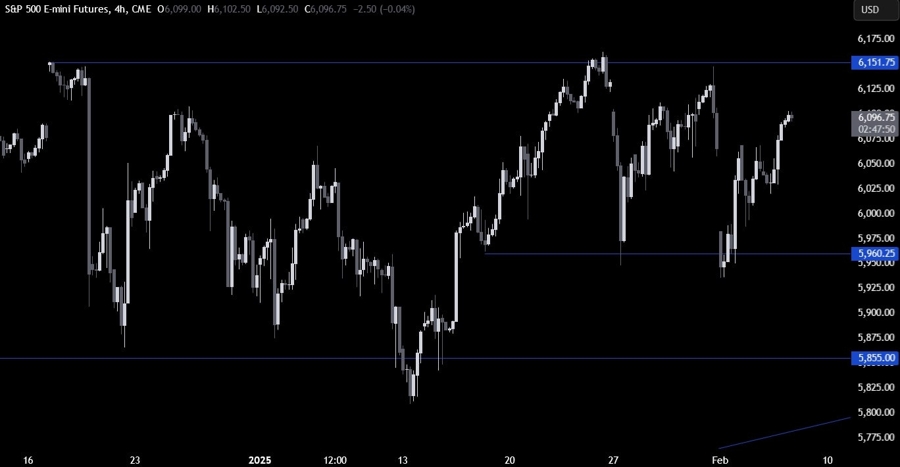
On the 4 hour chart, we can see that we have a smaller range between the 5960 support and the 6150 resistance. This could be a signal that overall, the bullish view is more probable and that the buyers remain in control. Again, there’s not much we can say here as what we need is a breakout.
S&P 500 Technical Analysis – 1 hour Timeframe
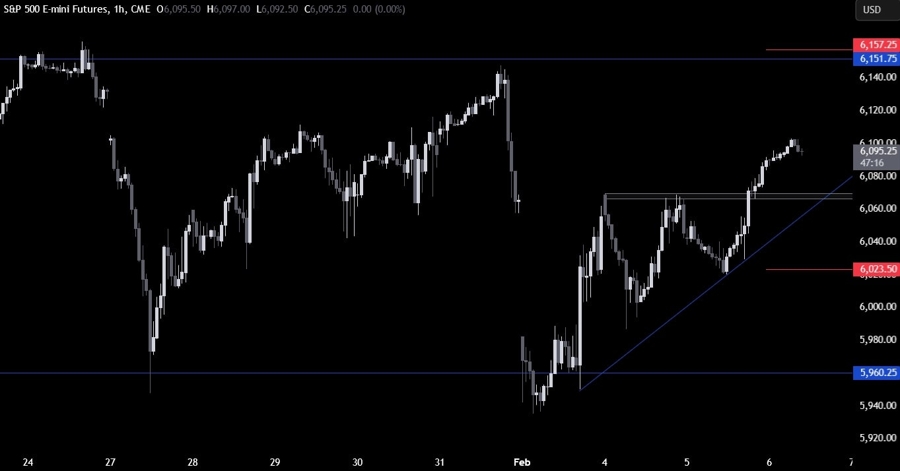
On the 1 hour chart, we can see that we have a nice support zone around the 6070 level where we can also find the upward trendline for confluence. If we get a pullback into the support, we can expect the buyers to step in with a defined risk below the trendline to position for the break above the resistance. The sellers, on the other hand, will want to see the price breaking lower to target a deeper pullback into the 5960 support next. The red lines define the average daily range for today.
Upcoming Catalysts
Today we get the latest US Jobless Claims figures, while tomorrow we conclude the week with the US NFP report.


