Fundamental Overview
The S&P 500 has been keeping the bid since last week as the softer than expected US inflation data gave the market a boost.
We haven’t got any key economic report since then and no comment from Fed speakers given that they are in the blackout period.
The main driver of the price action this week has been Trump and his tariffs threats. We saw a quick dip on Tuesday as he talked about imposing 25% tariffs on Canada and Mexico next week, but the market eventually erased the losses.
Overall, it seems like the market is optimistic about tariffs and the news that Trump is considering a 10% tariff on China might be a signal that he won’t be as aggressive as promised during his campaign given that back then he talked about 60% tariff on China.
S&P 500 Technical Analysis – Daily Timeframe
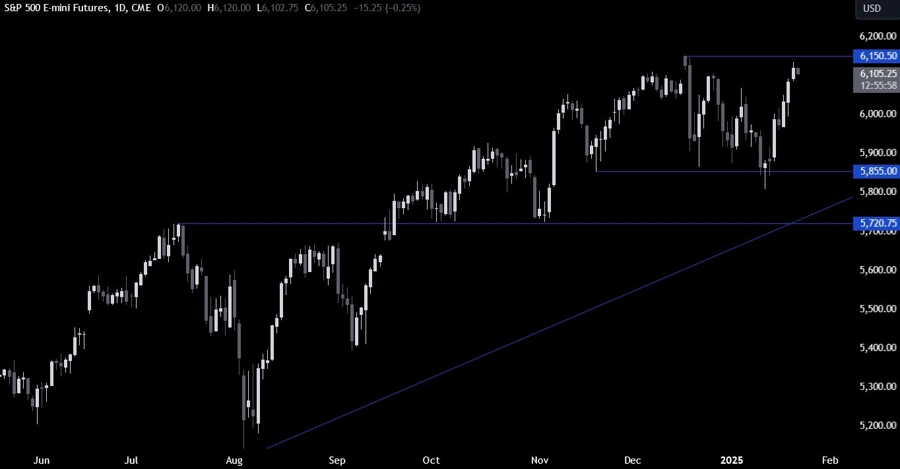
On the daily chart, we can see that the S&P 500 almost made a new all-time high as optimism returned in the market since last week’s softer US inflation data. The sellers will likely pile in around these levels with a defined risk above the all-time high to position for a drop back into the lows. The buyers, on the other hand, will want to see the price breaking higher to increase the bullish bets into new highs.
S&P 500 Technical Analysis – 4 hour Timeframe
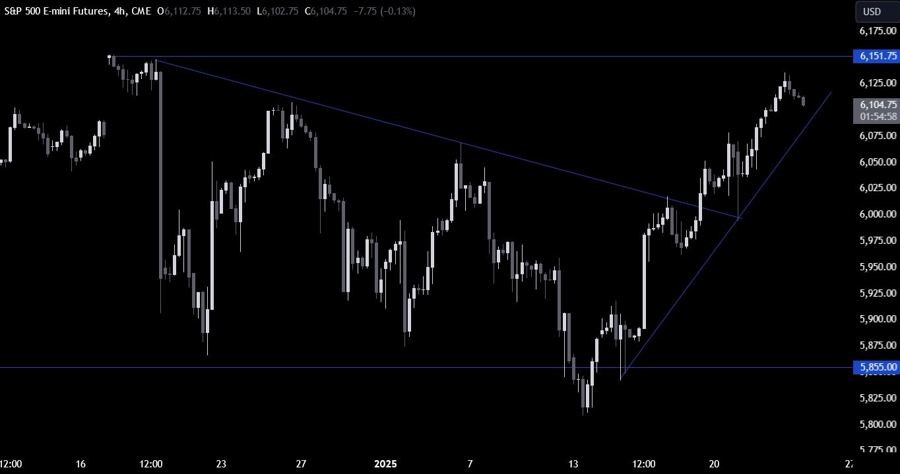
On the 4 hour chart, we can see that we have an upward trendline defining the bullish momentum. The buyers will likely lean on the trendline to position for a rally into a new all-time high, while the sellers will look for a break lower to increase the bearish bets into new lows.
S&P 500 Technical Analysis – 1 hour Timeframe
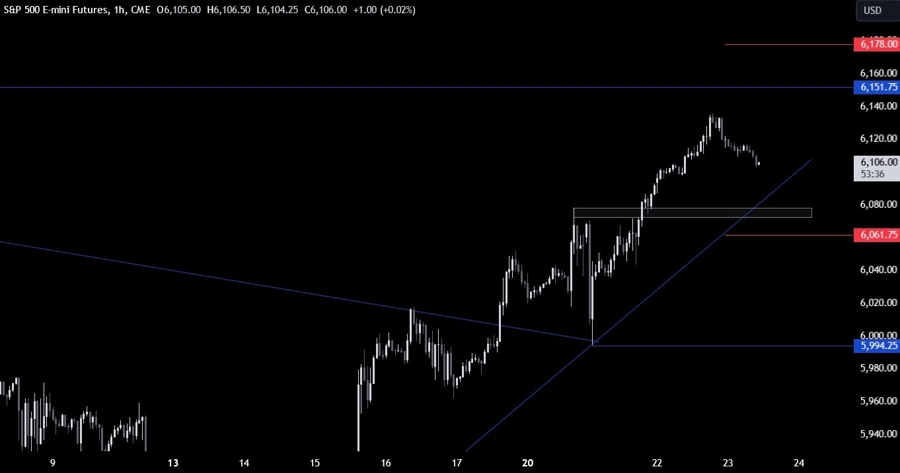
On the 1 hour chart, there’s not much we can add here as the buyers will look for a bounce around the trendline, while the sellers will look for a break lower to target the 6000 level next. The red lines define the average daily range for today.
Upcoming Catalysts
Today we get the latest US Jobless Claims figures, while tomorrow we conclude the week with the US Flash PMIs.


