Yesterday, the S&P 500 ended the day around the highs as the market continues to look through the beat in the US CPI report. As previously mentioned, the path of least resistance looks to be to the upside as long as growth remains pretty much stable, and the Fed doesn’t restart tightening. In the first case, the labour market will need to keep on being resilient, while in the second case, inflation should not start trending higher so much that the Fed is forced to change course.
S&P 500 Technical Analysis – Daily Timeframe
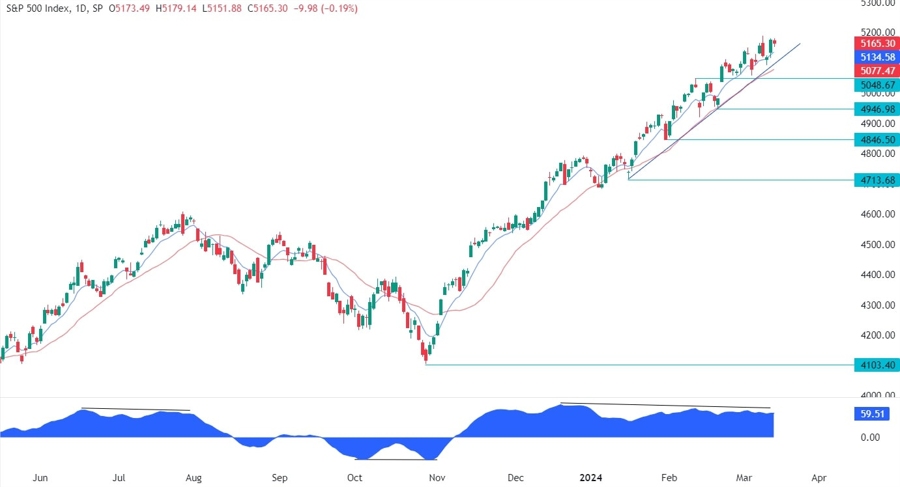
On the daily chart, we can see that the S&P 500 yesterday ended the day near the cycle high. From a risk management perspective, the buyers will have a better risk to reward setup around the trendline where we can also find the red 21 moving average for confluence. The sellers, on the other hand, will want to see the price breaking lower to position for a drop into new lows.
S&P 500 Technical Analysis – 4 hour Timeframe
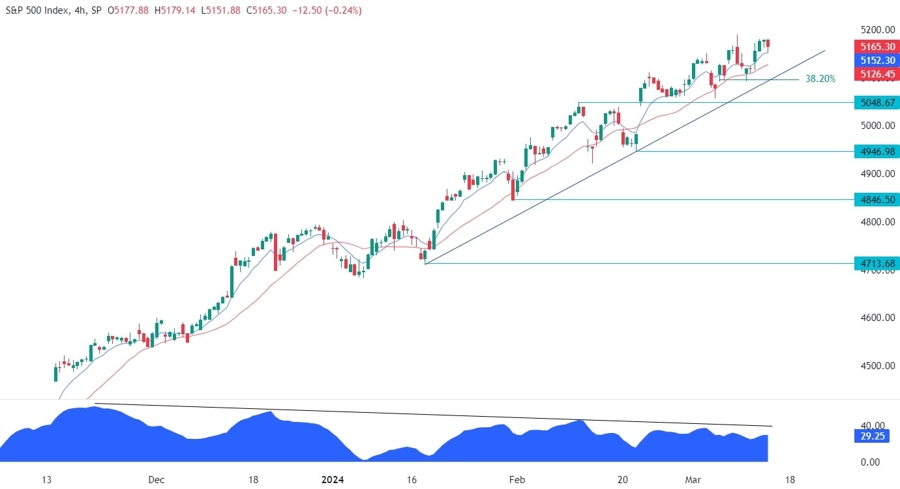
On the 4 hour chart, we can see that we can also find the 50% Fibonacci retracement level for extra confluence around the trendline. The price has been diverging with the MACD for a long time. This is generally a sign of weakening momentum often followed by pullbacks or reversals. In this case, it led to pullbacks into the red 21 moving average where the dip-buyers continue to pile in to position for new highs. If we were to get another pullback, we can expect the same around the moving average as long as the price doesn’t break below the trendline.
S&P 500 Technical Analysis – 1 hour Timeframe
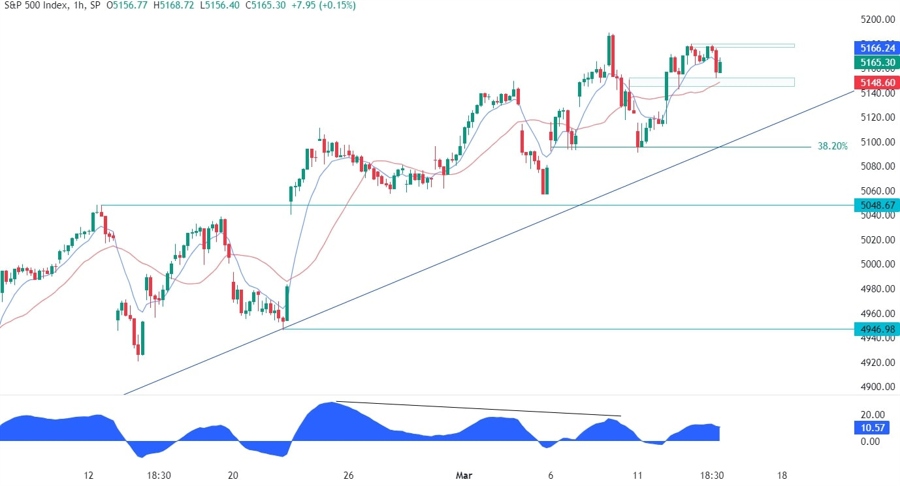
On the 1 hour chart, we can see that we have a “mini” range between the 5150 support and the 5180 resistance. A break to the upside should lead to a rally into new highs, while a break to the downside is likely to trigger a drop into the trendline.
Upcoming Events
Today we get the US PPI, the US Retail Sales and the US Jobless Claims figures. Tomorrow, we conclude the week with the University of Michigan Consumer Sentiment survey.


