Last Friday, the S&P 500 ended the day negative following the US NFP report. There was something for everyone. In fact, for the buyers, the payrolls number beat expectations while the average hourly earnings missed. For the sellers, the unemployment rate jumped to 3.9% and the household survey showed a third consecutive month of job losses. In this case, the technicals should help in determining the next move for the market as we approach some key levels.
S&P 500 Technical Analysis – Daily Timeframe
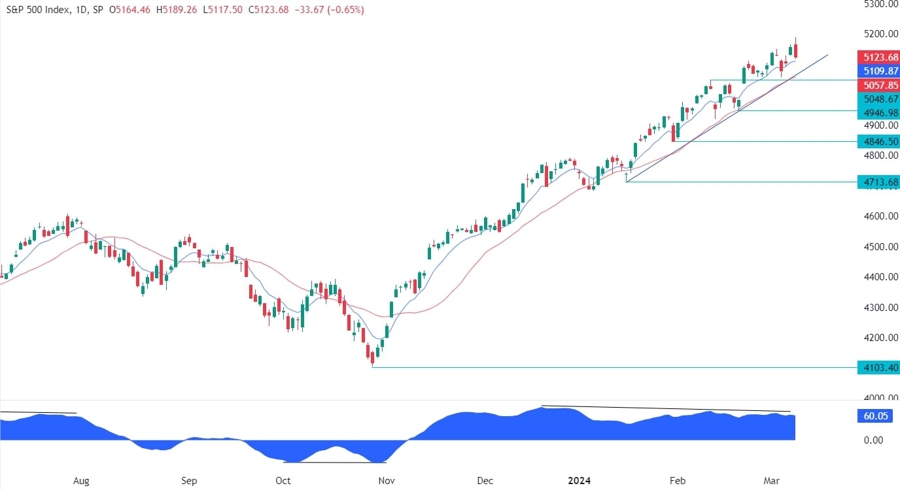
On the daily chart, we can see that the S&P 500 is approaching a key trendline where we can also find the red 21 moving average for confluence. This is where we can expect the buyers to step in with a defined risk below the trendline to position for a rally into a new all-time high. The sellers, on the other hand, will want to see the price breaking lower to increase the bearish bets into the 4946 level.
S&P 500 Technical Analysis – 4 hour Timeframe
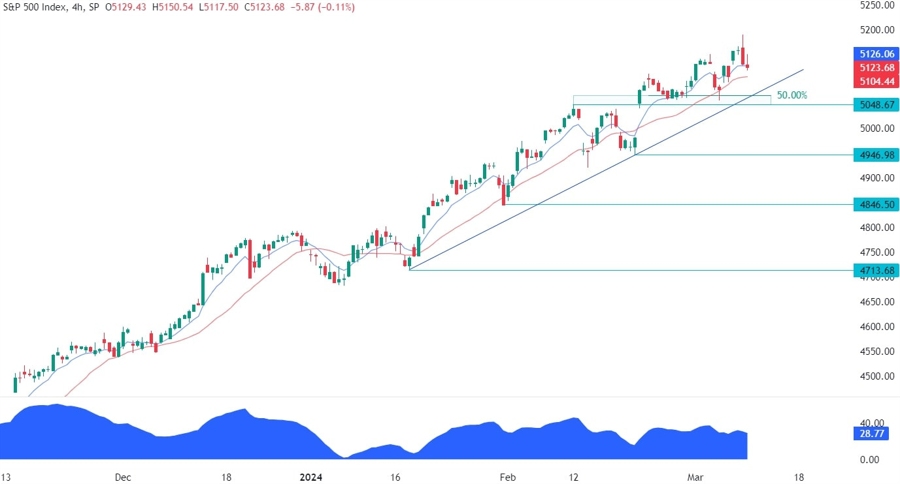
On the 4 hour chart, we can see the key support zone around the 5048 level marked with the green box where we can find also the 50% Fibonacci retracement level for further confluence. If the price breaks below this support, the bullish setup would be invalidated, and the sellers will gain more conviction to target new lows.
S&P 500 Technical Analysis – 1 hour Timeframe
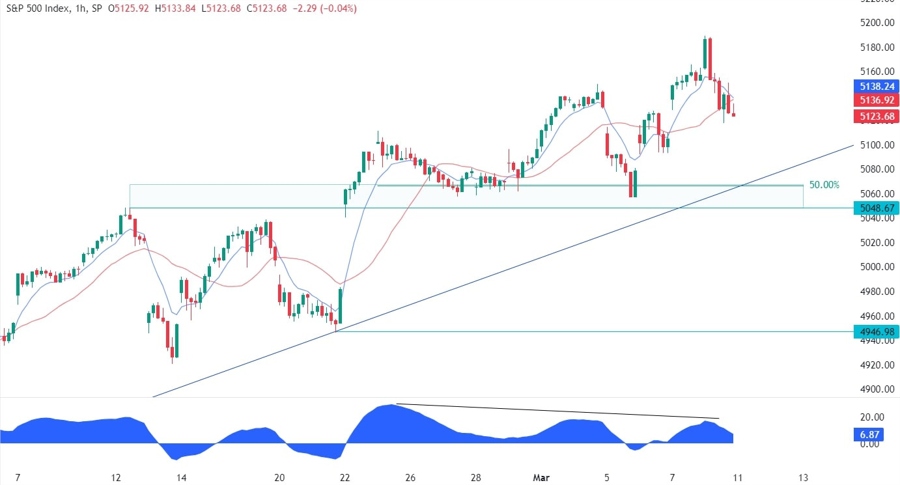
On the 1 hour chart, we can see that the latest leg higher diverged with the MACD. This is generally a sign of weakening momentum often followed by pullbacks or reversals. In this case, the target for the pullback should be right around the base of the divergent formation at the support zone.
Upcoming Events
Tomorrow we have the main event of the week, that is the US CPI report. On Thursday we get the US PPI, the US Retail Sales and the US Jobless Claims figures. On Friday, we conclude the week with the University of Michigan Consumer Sentiment survey.


