Last Friday, the S&P 500 surged to a new all-time high following a surprisingly strong NFP report. The headline number was much higher than even the most optimistic estimates with the unemployment rate ticking lower. There were also some bad things though like the plunge in Average Weekly Hours which contributed to push higher Average Hourly Earnings and the Household survey showing job losses for the second consecutive month.
In fact, even Fed’s Goolsbee mentioned this detail saying that “despite the brisk hiring numbers, weakness in overall hours worked suggests that this wasn’t as strong as that headline number suggested. There are big seasonal adjustments in January and the data might have been distorted a bit which makes trusting this report a little harder.
S&P 500 Technical Analysis – Daily Timeframe
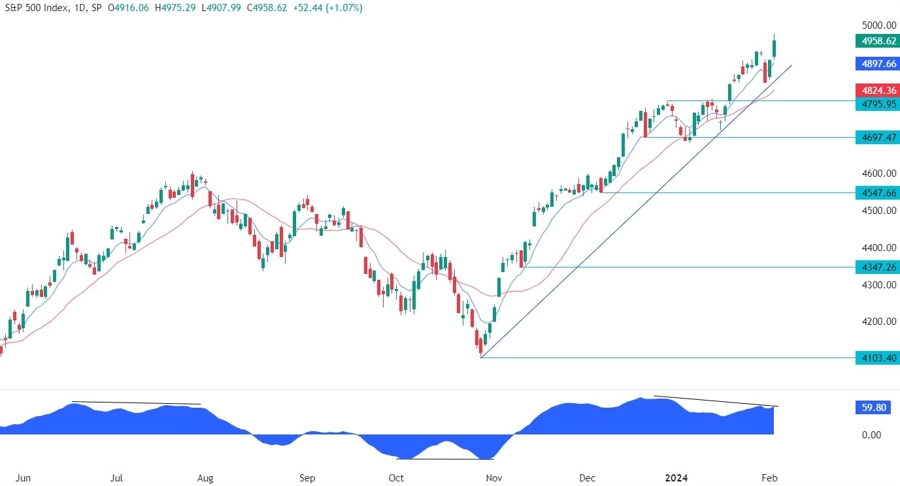
On the daily chart, we can see that the S&P 500 last week pulled back into the trendline following a bit more hawkish than expected Fed but bounced back strongly as the buyers stepped in with a defined risk below the trendline to position for new highs. There’s no level where the sellers can lean onto here, so we need to zoom in to see some more details.
S&P 500 Technical Analysis – 4 hour Timeframe
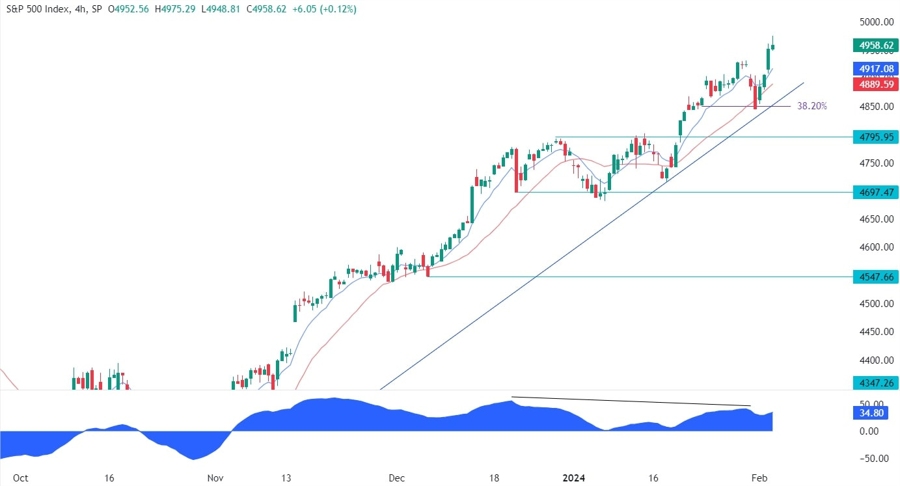
On the 4 hour chart, we can see that the buyers had also the 38.2% Fibonacci retracement level and the red 21 moving average for confluence. The buyers should keep on looking for dip-buying opportunities as long as the price stays above the trendline. The sellers, on the other hand, will want to see the price breaking below the trendline to start targeting new lower lows.
S&P 500 Technical Analysis – 1 hour Timeframe
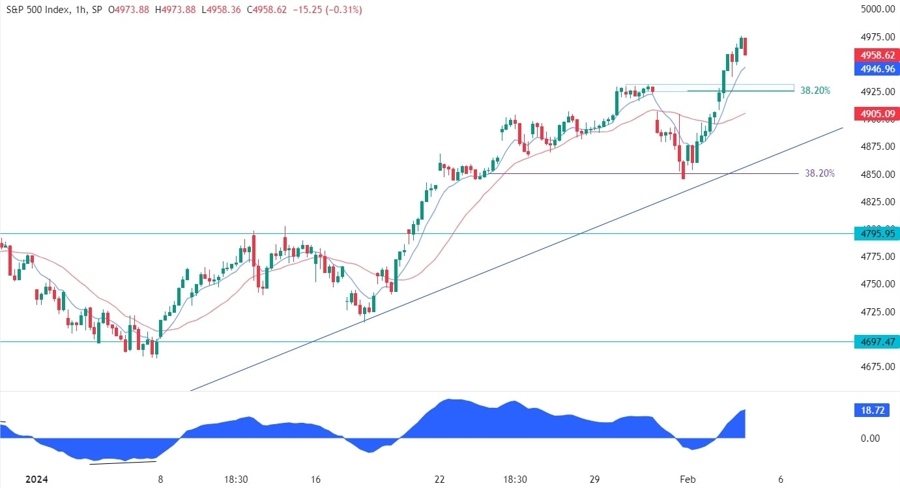
On the 1 hour chart, we can see that we have a minor support zone around the 4930 level where we can also find the 38.2% Fibonacci retracement level for confluence. This is where the buyers should step in with a defined risk below the level to position for new highs. The sellers, on the other hand, will want to see the price breaking lower to pile in and target a drop into the trendline.
Upcoming Events
This week is basically empty on the data front with just a couple of key economic releases. Today we have the US ISM Services PMI where the market will likely focus on the employment index given the big drop last month. On Thursday, we will see the latest US Jobless Claims figures where the market will want to see if the resilience in the labour market remains intact.


