Last Friday, the S&P500 finally surged to a new all-time high following the strong University of Michigan Consumer Sentiment report as the market continues to see a goldilocks economy. In fact, the US Jobless Claims have been improving and Retail Sales surprised to the upside. Moreover, we have the US PCE data on Friday where we will likely see another soft figure. On the other hand, the strong economic data is making the market to price out the rate cuts, which might eventually dent the economic and the stock market performance.
S&P 500 Technical Analysis – Daily Timeframe
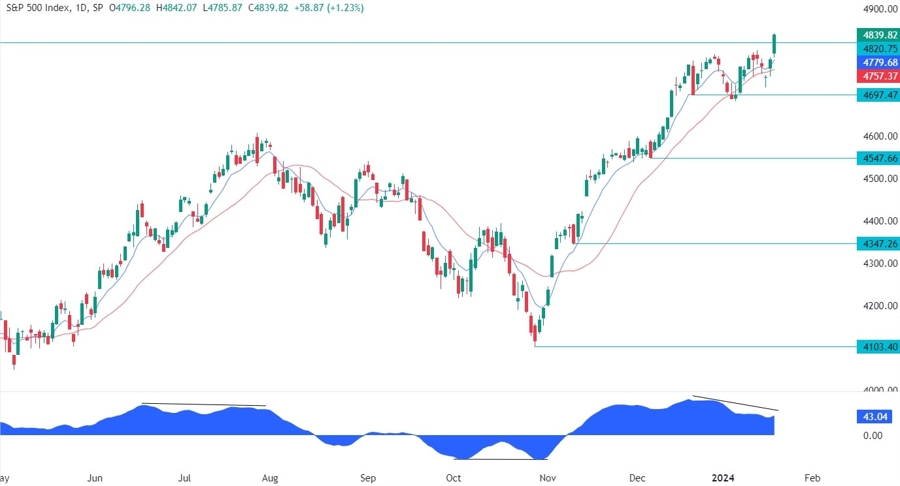
On the daily chart, we can see that the S&P 500 last Friday surged to a new all-time high as it looks like nothing can stop this train going now. We can notice though that the price is diverging with the MACD, which is generally a sign of weakening momentum often followed by pullbacks or reversals. In this case, we might get a pullback into the previous highs where the buyers will look to buy the dip and position for another all-time high.
S&P 500 Technical Analysis – 4 hour Timeframe
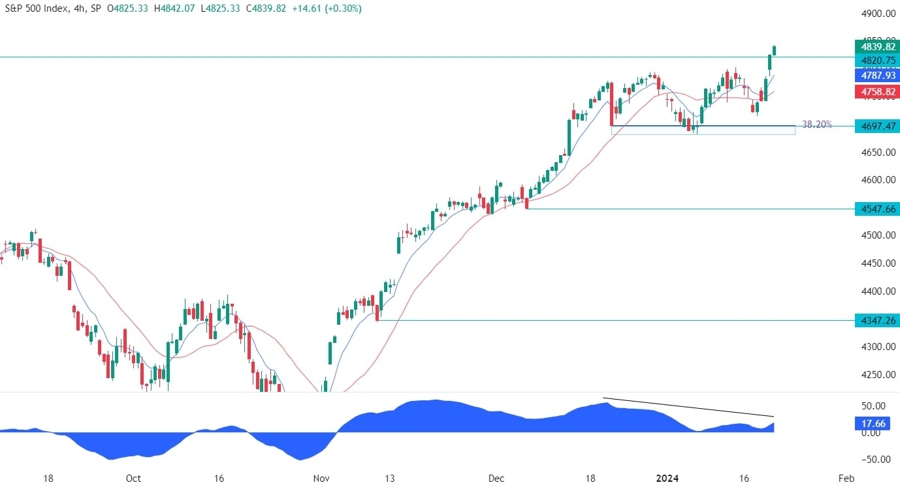
On the 4 hour chart, we can see that the price bounced on the key support zone around the 4700 level where we had also the 38.2% Fibonacci retracement level for confluence and started to rally as the economic data supported the soft-landing narrative. We can notice that the price is a bit overstretched now as depicted by the distance from the blue 8 moving average. In such instances, we can generally see a pullback into the moving average or some consolidation before the next move.
S&P 500 Technical Analysis – 1 hour Timeframe
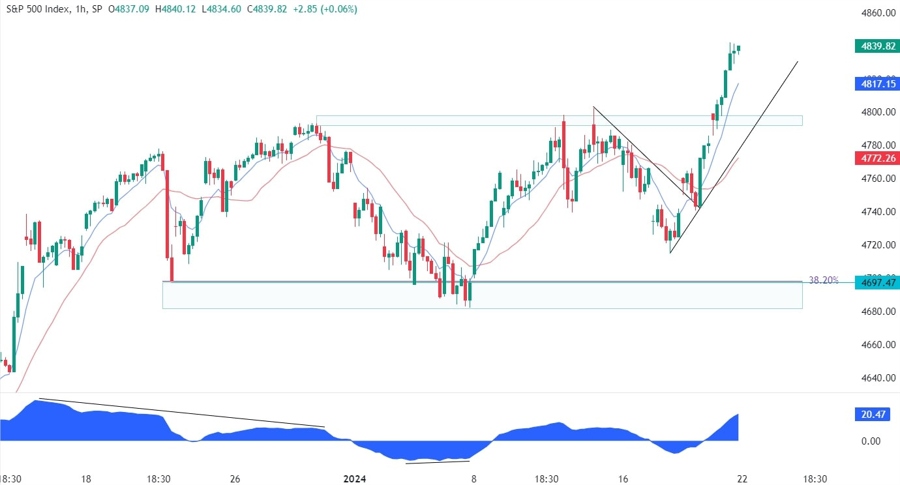
On the 1 hour chart, we can see more closely the recent price action with the market breaking the counter-trendline around the 4740 level, retesting it and surging into the highs. After a bit of hesitation, the price broke through the highs and rallied into a new all-time high following the strong consumer sentiment report. From a risk management perspective, the buyers will have a better risk to reward setup around the minor upward trendline where they will find the confluence with the previous highs and the red 21 moving average. The sellers, on the other hand, will want to see the price breaking lower to invalidate the bullish setup and position for a drop into the 4700 support.
Upcoming Events
This week is a bit more tranquil on the data front with the major releases scheduled for the final part of the week. We begin on Wednesday with the US PMIs while on Thursday we will see the Advance US Q4 GDP and the latest US Jobless Claims figures. Finally, on Friday we conclude the week with the US PCE report.


