Last Friday, the S&P 500 rallied despite the ISM Manufacturing PMI missing expectations and falling further into contraction. The market is still trading based on rate cuts expectations as the trigger for the rally was a neutral Fed Chair Powell speech where he didn't push back against the market's pricing. The market seems to be all-in on the soft-landing trade and ignoring the weakening economic data, especially on the labour market side. The sentiment is also getting a bit bubbly right when things might really go south, so the buyers might want to be extra cautious going forward.
S&P 500 Technical Analysis – Daily Timeframe
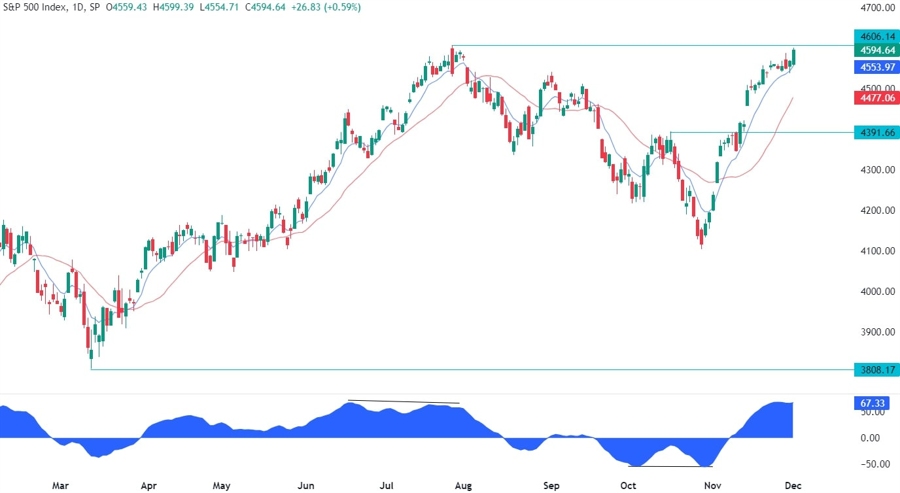
On the daily chart, we can see that the S&P 500 managed to extend to a new high last Friday reaching the cycle high. From a risk management perspective, this is a really bad spot for the buyers to increase their bullish bets, especially after such a strong rally. The sellers, on the other hand, will likely keep on piling in around these levels with a defined risk above the cycle high to target a drop into the 4400 level.
S&P 500 Technical Analysis – 4 hour Timeframe
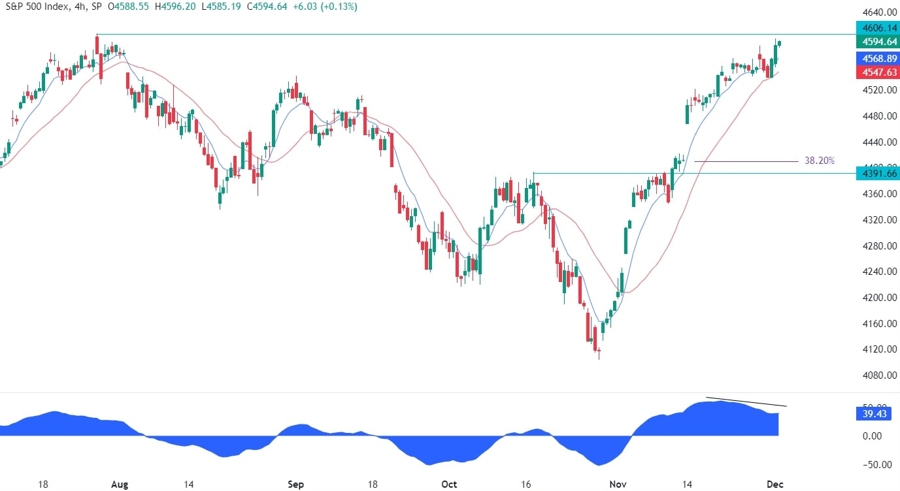
On the 4 hour chart, we can see that the price has been diverging with the MACDinto the cycle high. This is generally a sign of weakening momentum often followed by pullbacks or reversals. This should be another signal for the buyers to be extra cautious around these levels, while the sellers are likely to take it as a confirmation that we could see at least a decent pullback.
S&P 500 Technical Analysis – 1 hour Timeframe
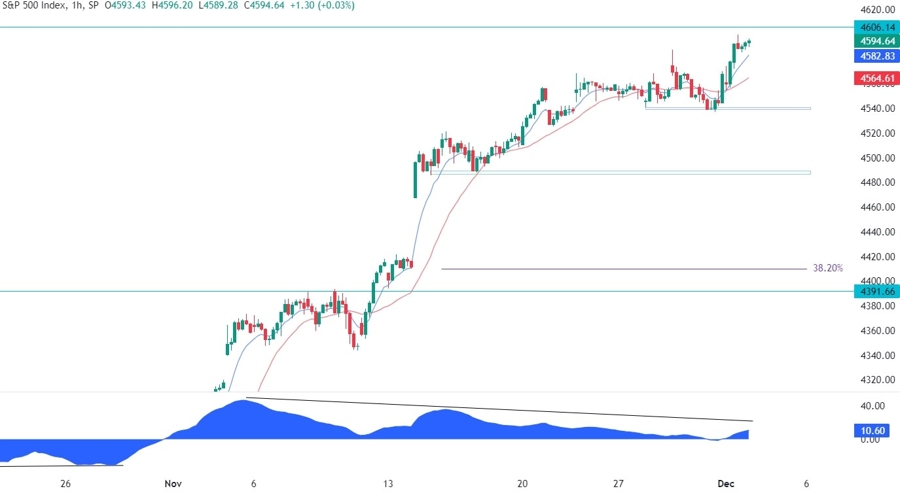
On the 1 hour chart, we can see more closely the divergence with the MACD, which has been going on since the breakout of the key resistance at 4400. The price bounced on the swing low last week before extending to the cycle high, so the sellers will need the price to break below that level to increase their bearish bets into the 4490 level and upon a further break, extend the target to the 4400 level. The buyers, on the other hand, are likely to lean on those levels to position for a new rally.
Upcoming Events
This week we will see lots of US labour market data culminating with the NFP release on Friday. Tomorrow, we have the ISM Services PMI and the US Job Openings reports. On Wednesday, we will get the US ADP data. On Thursday, it will be the time for the US Jobless Claims figures, while on Friday we conclude the week with the NFP report.
See the video below


