The S&P 500 couldn't increase the gains much this week despite a less hawkish Fedspeak and increased rate cuts expectations. One good reason might be the weakening of US data, especially on the labour market side, as we have also seen recently in the details of the US Consumer Confidence report. Historically, the sustained rise in the unemployment rate is bearish for the stock market.
S&P 500 Technical Analysis – Daily Timeframe
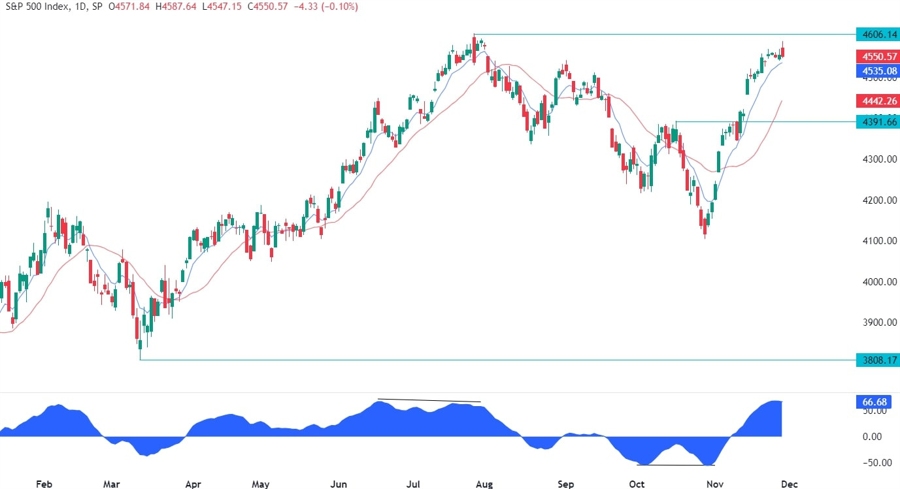
On the daily chart, we can see that the S&P 500 began to lose some steam as it approached the cycle high at 4607. We might start to see some profit taking at these levels after such an incredible rally which should finally offer a decent pullback for the buyers to load up on longs again at better prices. The sellers, on the other hand, are likely to step in around these levels with a defined risk above the cycle high to position for a drop into new lows.
S&P 500 Technical Analysis – 4 hour Timeframe
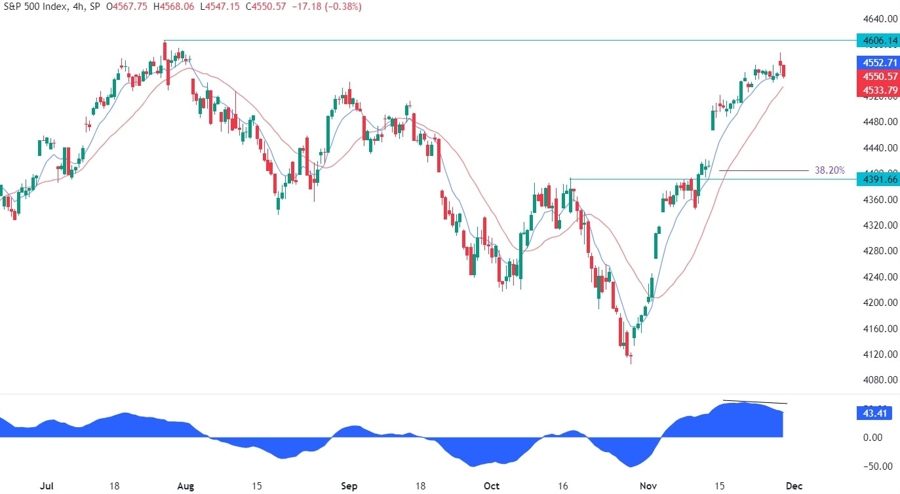
On the 4 hour chart, we can see that the price has been diverging with the MACDas it was approaching the cycle high. This is generally a sign of weakening momentum often followed by pullbacks or reversals. This might be a signal that we might indeed see a deeper pullback soon. From a risk management perspective, the buyers will have a much better risk to reward setup around the previous resistance turned support at 4400 level where we can also find the 38.2% Fibonacci retracement level for confluence.
S&P 500 Technical Analysis – 1 hour Timeframe
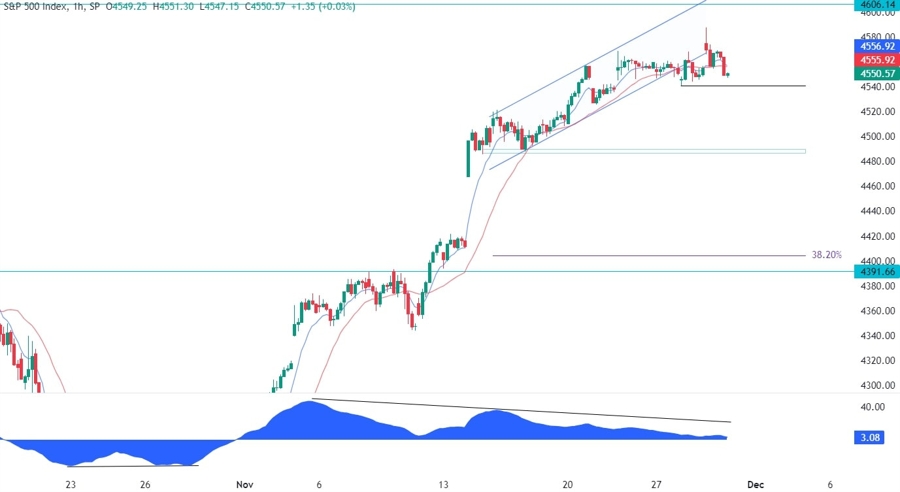
On the 1 hour chart, we can see more closely the divergence with the MACD, which has been going on since the breakout of the key resistance. The price recently broke the rising channel to the downside, which is another bearish signal. The first target for the sellers should be the base of the channel around the 4485 level and upon a further break lower, the support at 4400. The buyers, on the other hand, will lean on those levels to position for further upside targeting a break above the cycle high.
Upcoming Events
Today we will get the US PCE and US Jobless Claims data with the market likely focusing more on the Jobless Claims figures given that we already saw the latest inflation data with the US CPI report just two weeks ago. Tomorrow, we conclude the week with the US ISM Manufacturing PMI which missed expectations by a big margin the last time.


