The S&P 500 ended last week on a positive note as we got a strong rally despite some concerning data. The University of Michigan consumer sentiment report missed forecasts across the board by a big margin once again. The bearish signs keep on accumulating with the recent hawkish tone from Fed speakers and the softening labour market data with the big misses in the recent NFP report and the rising Continuing Claims. The buyers should be very careful going forward.
S&P 500 Technical Analysis – Daily Timeframe
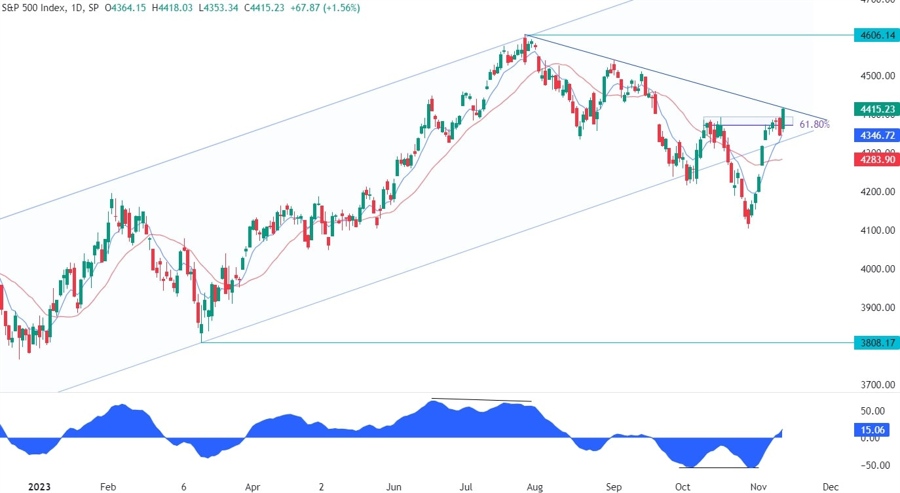
On the daily chart, we can see that the S&P 500 last Friday rallied into weekend breaking above the strong resistance formed by the previous swing high level and the 61.8% Fibonacci retracement level. The price is now testing a key trendline and this is where the sellers are likely to step in more aggressively with a tight risk above the trendline to position for a drop into new lows with a great risk to reward setup.
S&P 500 Technical Analysis – 4 hour Timeframe
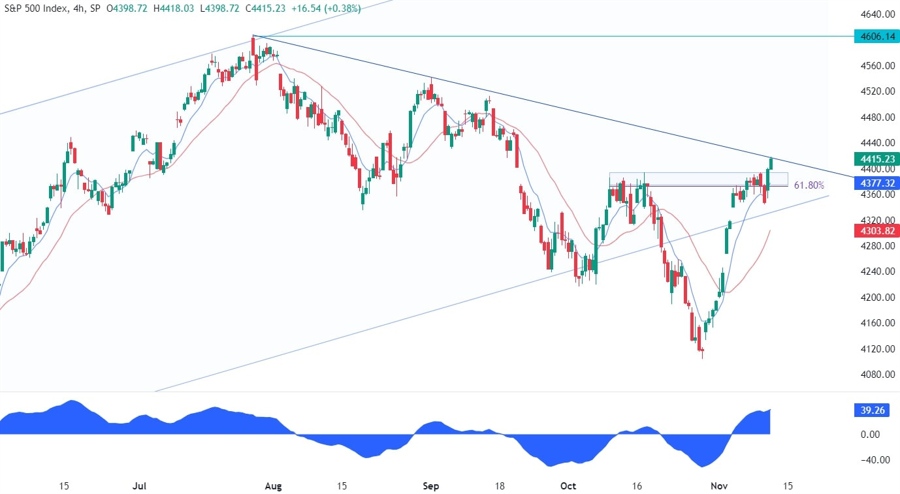
On the 4 hour chart, we can see more closely the price action around the key trendline and the resistance zone. If the sellers manage to fade the Friday’s rally entirely, that will leave behind a fakeout, which is a reversal pattern. The buyers will need the price to break above the trendline to invalidate the bearish setup and increase the bullish bets into the high at 4607.
S&P 500 Technical Analysis – 1 hour Timeframe

On the 1 hour chart, we can see that the price is diverging with the MACD right at the key trendline. This is generally a sign of weakening momentum often followed by pullbacks or reversals. If we get a pullback, the buyers should lean on the upward trendline, and the resistance turned support to position for a breakout. The sellers, on the other hand, will want to see the price breaking below the support and the trendline to confirm the reversal and position for a drop into new lows.
Upcoming Events
This week we have some top tier economic releases. We begin tomorrow with the US CPI report which is going to be one of the most important events of the week. On Wednesday, we have the US Retail Sales and PPI data, while on Thursday we conclude with the latest US Jobless Claims figures.
See the video below


