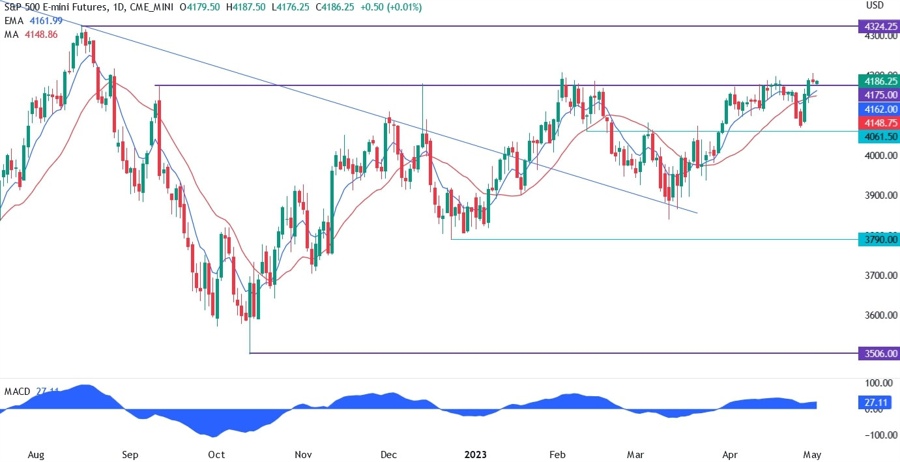
On the daily chart below for the S&P 500, we can see that after the better than expected US GDP report and the beat in Jobless Claims, the buyers piled in again and pushed the price back to the key 4175 resistance. Yesterday the price broke out but it’s struggling again to really take off and it now looks like we will get another failed break.
The ISM Manufacturing PMI came out better than expected with the inflation and employment sub-indexes back into expansion. This may be bad news for the Fed and thus for the market as a whole because they may be forced to keep hiking if their cumulative tightening hasn’t been enough to return inflation back to their target.

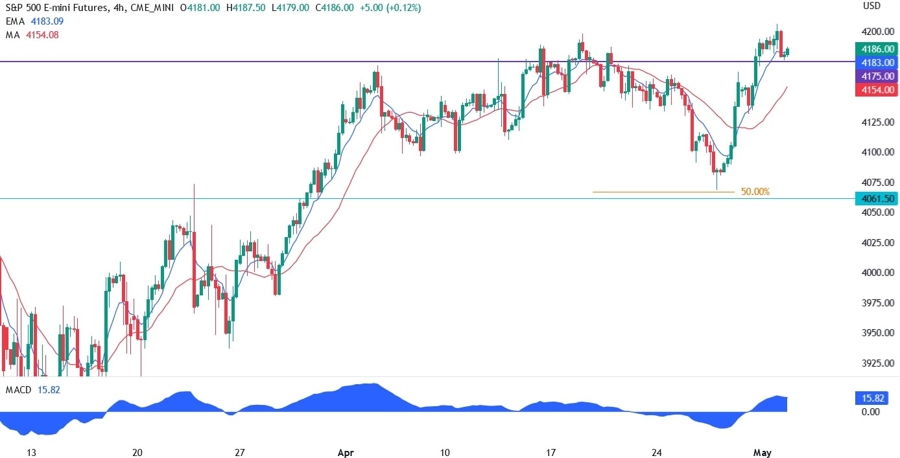
In the 4 hour chart below, we can see that the price bounced from the 50% Fibonacci retracement level near the previous resistance turned support. The moving averages are again crossed to the upside with the buyers in control.
It will take a break below the 4130 level for the sellers to regain control. This week has a lot of top tier economic events like the ISM PMI reports, the FOMC and the NFP. The data will drive the market so pay close attention to it.

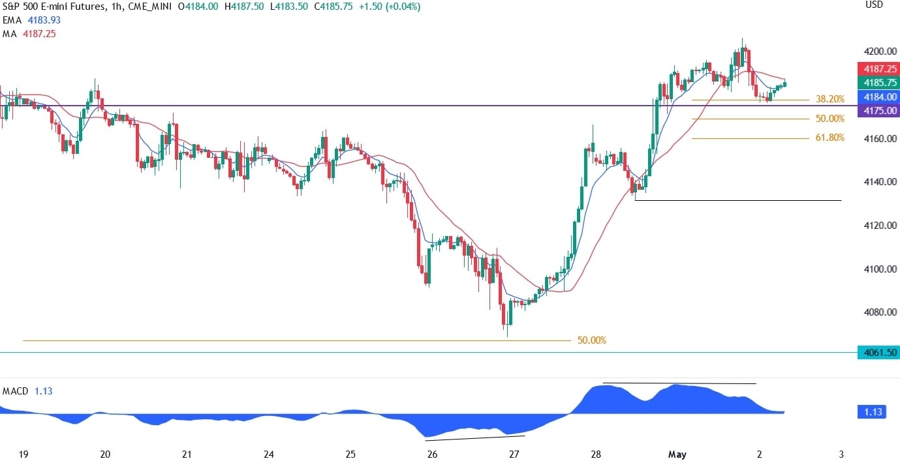
In the 1 hour chart below, we can see that the price was diverging with the MACD coming to the 50% Fibonacci retracement level. This is generally a signal of a weakening momentum and it’s often followed by pullbacks or reversals. In this case we got a reversal. Now the price is again diverging with the MACD as it tries to take off, but the odds after yesterday’s data are slim.
If the price breaks below the 38.2% Fibonacci level, we should see the buyers trying to defend the 61.8% level where we can also find a previous swing level for support. Otherwise, the sellers will keep targeting the 4130 swing level and on a successful breakout, the support at 4061.


