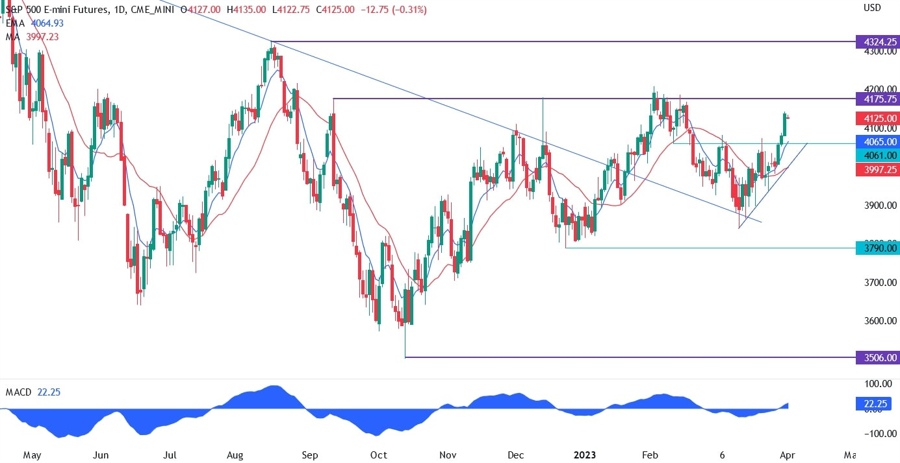
On the daily chart for the S&P 500 below, we can see that once the price broke above the 4061 resistance, the buyers piled in and extended the move considerably. The target is the key 4175 resistance that kept the market down since September 2022. A clear break above that level would be a big event and may lead to some FOMO buying extending the move to the high at 4324.
As of now, we can see that the trend remains bullish as the moving averages are crossed to the upside. The caveat is that the price at the moment is a bit overstretched as depicted by the price distance from the blue short term moving average . This is generally a signal to be cautious as the market may pull back before the next move.
S&P 500 technical analysis
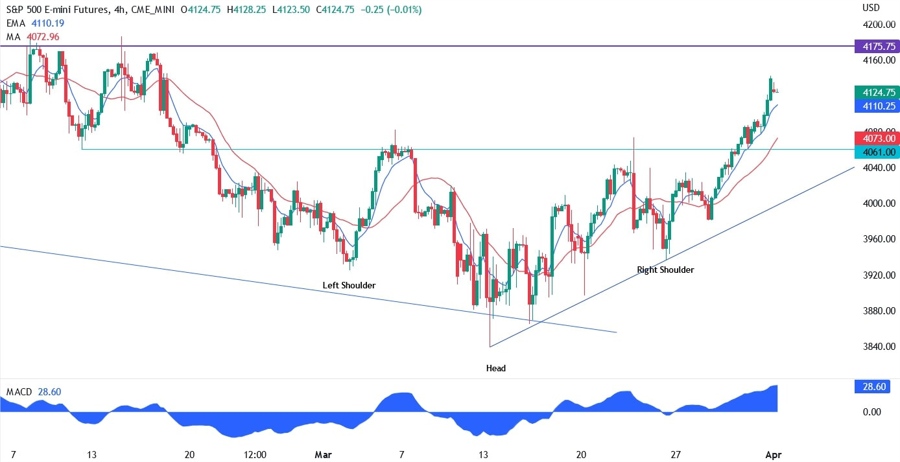
In the 4 hour chart below, we can see that we may have a big inverted head and shoulders pattern that formed right at the broken trendline that acted as support. The neckline was the resistance at 4061 that has been clearly broken. From a risk management perspective, a pullback would be welcome for the buyers now, with the neckline being a perfect spot. For the sellers there’s not much to lean onto here, so it may be better to sit out for now.
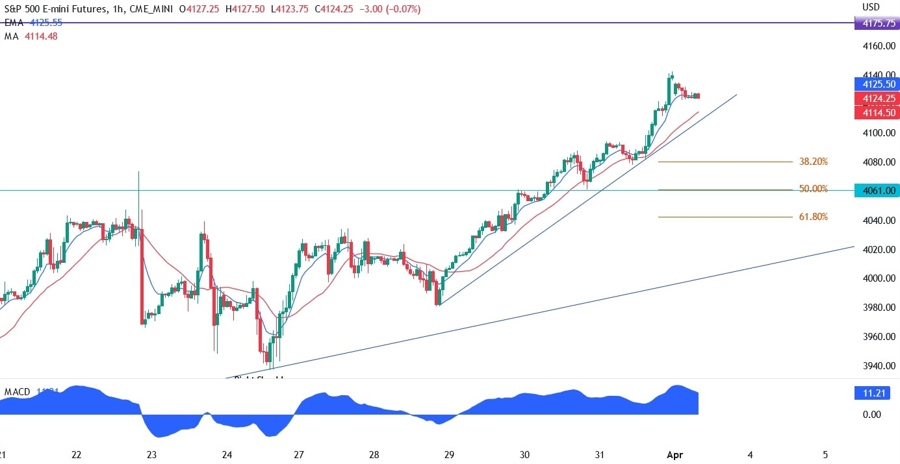
In the 1 hour chart below, we can see that we have a minor trendline that has confluence with the red long period moving average. Aggressive buyers may lean on it for another push to the upside targeting the resistance at 4175, while conservative buyers would like to wait for a pullback to the 50% Fibonacci retracement level and the neckline. The sellers may want to pile in on the break of the trendline with the first target being the neckline.