SPX Order-Flow & Technical Analysis for Today with tradeCompass (Sep 4, 2025)
Hello traders and investors, before the NFP is out in a few hours, we start out with looking at the data of the SPX as of yesterday's close. We follow up with a S&P 500 futures analysis, at the bottom of this page, according to the tradeCompass methodology. Let's dive in to the SPX first
SPX is bullish above: 6510.8–6511.0 (clear acceptance above today’s high)
SPX is bearish below: 6507.5
Primary bias: Slight bearish tilt
Partial targets (both directions):
VWAP (intraday “fair value”)
Developing POC (volume profile magnet)
Value Area High / Value Area Low (today’s VAH/VAL)
Market context & directional bias
Spot: 6,502.09 at the close of 04 Sept (yesterday).
Options order flow: Net option delta ≈ –2,133, with bearish pressure –35,949 vs bullish +33,816 deltas → a mild negative on-balance read.
Weighted averages: Bullish W‑Avg 6509.09 vs Bearish W‑Avg 6509.16 → tight balance around 6509.1–6509.2 (micro pivot).
Backdrop: Technical label shows Uptrend and 30‑day IV 11.8 (subdued). Put OI > Call OI on the snapshot, which slightly leans defensive, but intraday execution still hinges on the thresholds above.
Takeaway: We’re hovering at a micro‑pivot (~6509.1–6509.2) with a small bearish skew in option delta. Momentum confirmation is needed: strength only if price can accept above 6510.8–6511.0; weakness confirmed below 6507.5.
Options market on SPX tells us that...
Yesterday’s net option delta –2,133 with nearly equal bullish/bearish weighted averages says balance with a bearish edge. Combine this with price acceptance around 6511/6507.5 to time entries; don’t rely on order flow alone—let price confirm.
Now let's dive into the S&P 500 Futures Analysis for Today
S&P 500 Futures Market Context & Directional Bias
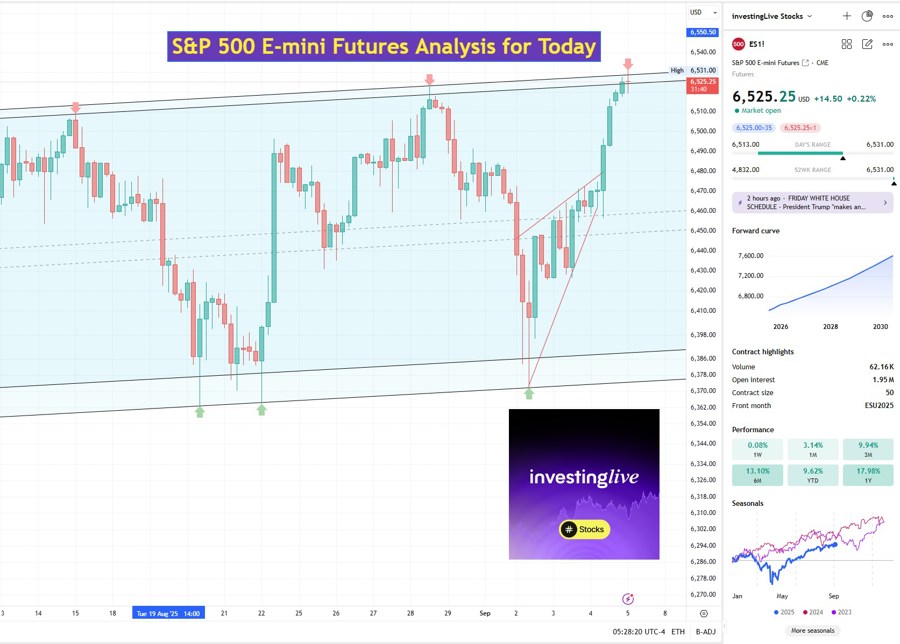
S&P 500 E-mini futures (ES) marked a fresh all-time high in pre-market trading, but momentum has stalled as the market awaits today’s non-farm payrolls report. Historically, in the hours before a major data release, range-bound behavior is common as traders reduce exposure.
At the time of writing, ES is trading near 6,525, sitting just under today’s Value Area High (6,527.75). The fair value zone is anchored around the VWAP at 6,521.95 and POC at 6,521.75. On the downside, today’s Value Area Low sits at 6,518.75, while yesterday’s value levels cluster below at 6,516.50 (VAH) and 6,511 (POC).
This tight structure suggests most breakout attempts are likely to fade until NFP provides direction. The tradeCompass map therefore emphasizes controlled, short-range targets with risk management front and center.
S&P 500 Futures Key Levels & Partial-Profit Strategy for Today (05 Sept, 2025)
Bearish scenarios (below 6,527):
First reaction level at 6,522 (VWAP zone), where fair value often acts as a magnet.
Next pause expected around 6,519 (just above VAL), likely to attract liquidity.
Additional downside checkpoint at 6,517, near today’s low-volume edge.
Further extension possible to 6,514.5, a liquidity pocket linked to yesterday’s highs.
Deeper bearish probe may touch 6,511.5, just above yesterday’s POC.
Bullish scenarios (above 6,535):
First upside target at 6,540, a logical extension point.
Continuation into 6,545, testing early breakout enthusiasm.
If momentum sustains, possible stretch toward 6,550.
Educational Insight: Why VWAP, Value Area, and POC Matter
For intraday traders, these reference points are not arbitrary.
VWAP (Volume Weighted Average Price): Reflects where the bulk of trading has occurred relative to volume. Prices gravitating back to VWAP signal reversion to perceived fair value.
Value Area (VAH/VAL): Defines the 70% zone of trading activity. Price tends to oscillate within these bounds unless strong directional pressure emerges.
Point of Control (POC): The single price level with the highest traded volume, often acting as a magnet intraday.
Together, these metrics help traders recognize when price is likely to mean-revert versus when genuine imbalance emerges. The tradeCompass methodology integrates them into clear bullish and bearish thresholds, simplifying decision-making in complex market conditions.
S&P 500 Futures Trade Management Reminders (...according to the tradeCompass methodology)
One trade per direction at a time within tradeCompass.
Take partial profits as levels are hit and move stops to entry after the second target.
Stops should not be placed beyond the opposite threshold (e.g., don’t hold shorts if price sustains above 6,535).
Stay flexible: range days can turn into trend days if NFP sparks a decisive break.
Outlook Beyond NFP
While today’s map is focused on intraday ranges, traders should keep in mind that a negative NFP shock could shift the bias. Below 6,485 (yesterday’s VWAP), downside swing targets emerge at 6,450 (round number liquidity pool) and 6,439 (September 3rd VAL).
Disclaimer
This analysis is for decision support only. It is not financial advice. Futures trading involves significant risk, and traders should evaluate their own risk tolerance before acting. Always trade at your own risk and adapt to evolving market conditions. Visit investingLive.com for additional views
