Last week was the Jackson Hole Symposium week and we have heard from many Fed members about their opinions on the momentary policy going forward. There seems to be a consensus for a pause in September as they try to “carefully” assess the lag effects of their tightening to date. Nonetheless, they are ready to do more if conditions require further tightening and in fact, they keep reaffirming their data dependency. The economic data since the last FOMC meeting has been surprising to the upside with the labour market remaining very strong, but the last two inflation reports showed the Core M/M inflation rising by just 0.16%. Overall, it looks like a soft landing scenario but the latest US PMIs showed that there might be pain ahead.
Russell 2000 Technical Analysis – Daily Timeframe
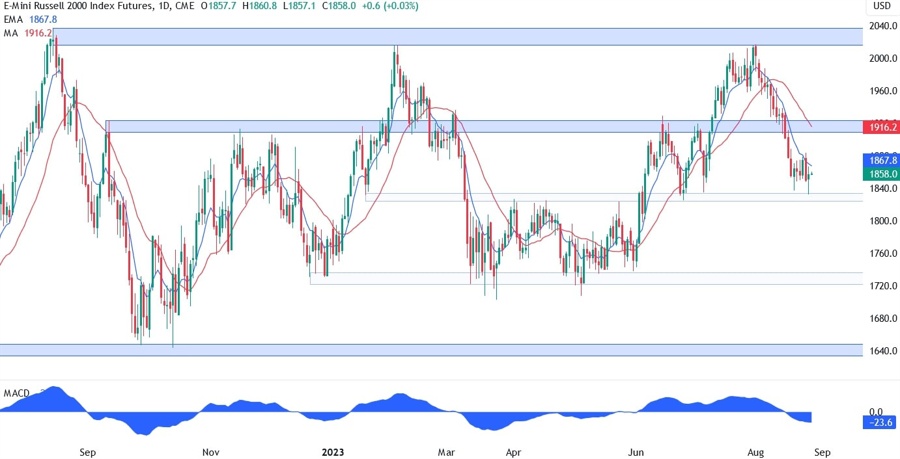
On the daily chart, we can see that the Russell 2000 sold off from the 2030 resistance zone all the way back to the 1820 support area. The price has been consolidating ever since it tested the support zone as the market awaits new catalysts to push it in either direction. Nevertheless, this is a key level, and we can expect the buyers to pile in here with a defined risk below the level to target the 1920 resistance. The sellers, on the other hand, will want to see the price breaking lower to pile in even more aggressively and take the Russell 2000 into the 1720 level.
Russell 2000 Technical Analysis – 4 hour Timeframe
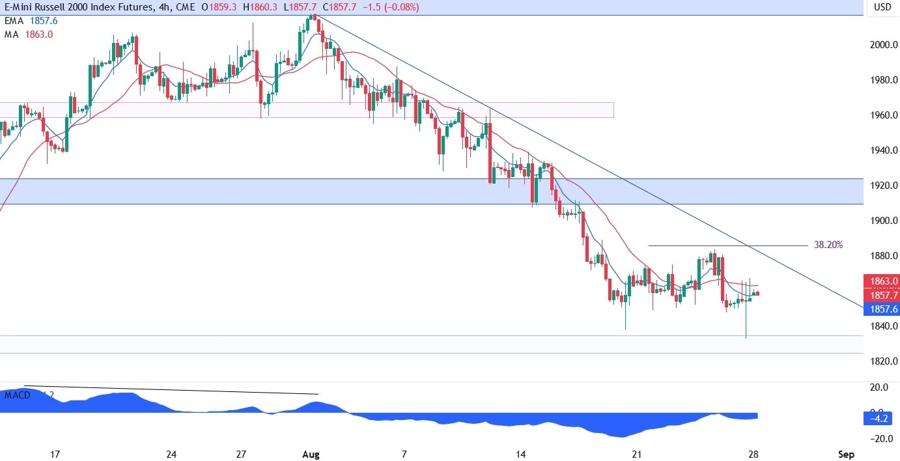
On the 4 hour chart, we can see that the buyers are indeed leaning on the support zone as we got two big candlestick wicks in what could end up being a double bottom. The price will need to break above the downward trendline and the 38.2% Fibonacci retracement level to confirm the pattern, but we can expect the buyers to come into the market already expecting the breakout.
Russell 2000 Technical Analysis – 1 hour Timeframe
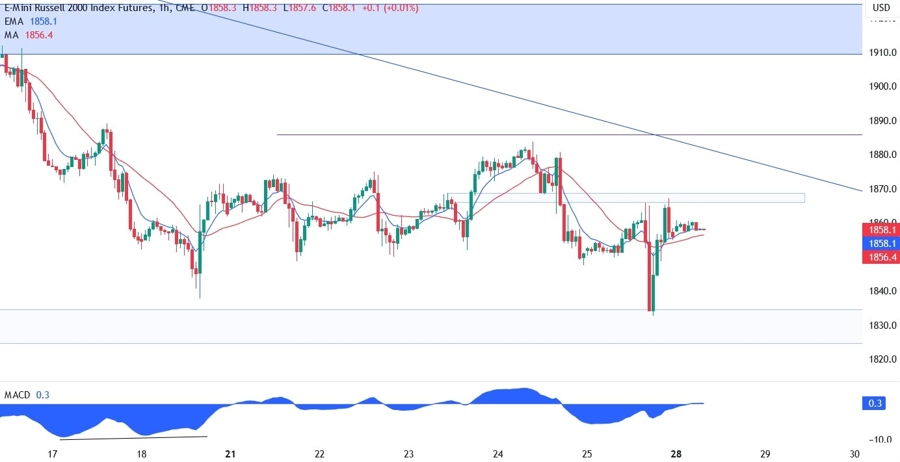
On the 1 hour chart, we can see the quick drop and recovery soon after the Fed Chair Powell speech at the Jackson Hole Symposium as he reaffirmed their data dependency but stressed also the need to be careful. We can also see that we have an interesting zone around the 1867 level where the price has reacted to multiple times. Although it’s better to stay out of the ranges and wait for a clear breakout, a break to the upside of this 1867 zone may lead to a rally into the 38.2% Fibonacci retracement level and possibly even a breakout, while the sellers may lean onto it to position for more downside expecting a break below the support.
Upcoming Events
This week is an important one given that we will see many key labour market data, including the US NFP, before the next FOMC meeting. We start tomorrow with the US Consumer Confidence and the US Job Openings. On Wednesday, we have the US ADP report. Moving on to Thursday, we will have the US Jobless Claims and the US PCE data. Finally, we conclude the week with the US NFP and the ISM Manufacturing PMI on Friday. Although the Fed keeps all the options on the table, it’s also leaning more towards a pause in September, so we will need strong data to make the market to expect a hike at the upcoming meeting.
