Fundamental Overview
The Russell 2000 continues to maintain a positive outlook while even outperforming the major indices given less exposure to overvalued tech stocks.
The market has been making new highs ever since the last US inflation data as it marked the top in the repricing of rate cuts expectations and inflation fears.
The Fed yesterday kept interest rates unchanged as widely expected and Fed Chair Powell maintained a neutral stance as they are waiting for more inflation progress and more clarity on Trump’s policies before cutting again.
The market is now back in expecting two rate cuts by the end of the year with the first one seen in June. The risks ahead lie around inflation as the market will want to see more progress.
There are also risks to growth, especially if Trump’s tariffs lead to trade wars. Right now, it seems like he just threatens countries with tariffs to get better deals.
Russell 2000 Technical Analysis – Daily Timeframe
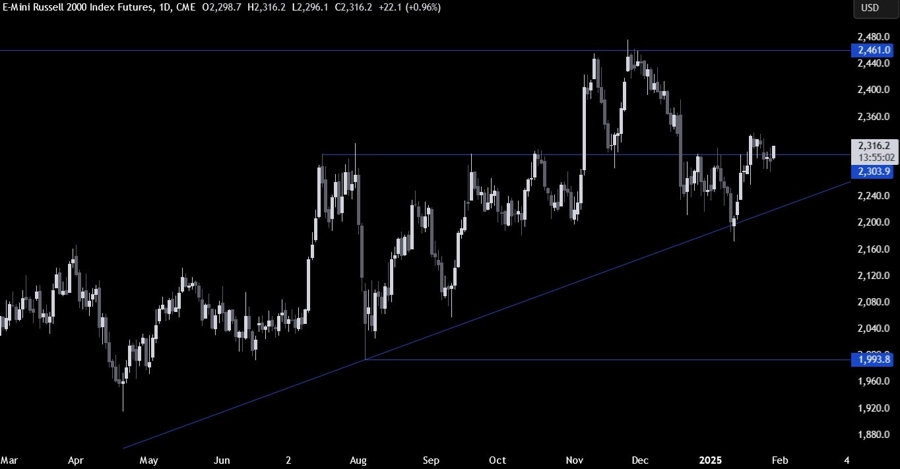
On the daily chart, we can see that the Russell 2000 is breaking above the key 2300 resistance. This is where the buyers will likely pile in with a defined risk below the 2300 level to position for a rally into the all-time highs. The sellers, on the other hand, will want to see the price falling back below the level to target the 2200 level next.
Russell 2000 Technical Analysis – 4 hour Timeframe
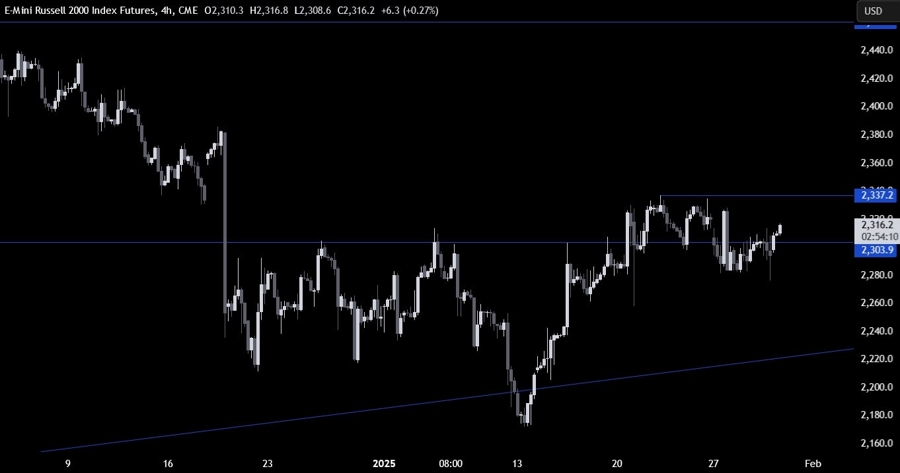
On the 4 hour chart, we can see more clearly the recent rangebound price action around the 2300 level. The positive Fed Chair Powell’s comments yesterday seem to have given the buyers more conviction for more upside with the 2337 level as the next target. The sellers, on the other hand, will likely look for a drop below the 2300 level before piling in for new lows.
Russell 2000 Technical Analysis – 1 hour Timeframe
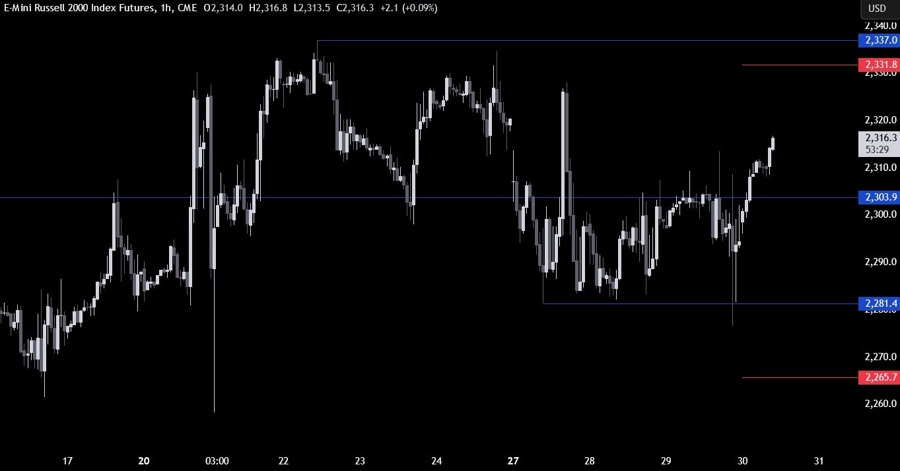
On the 1 hour chart, there’s not much else we can add here as the buyers will continue to push into the 2337 level, while the sellers will look for a drop back below the 2300 level to target new lows. The red lines define the average daily range for today.
Upcoming Catalysts
Today we get the US Q4 GDP report and the latest US Jobless Claims figures. Tomorrow, we conclude the week with the US PCE and the US Employment Cost Index.
