It’s increasingly evident that the market is taking the weaker labour market data as good news for inflation and the soft-landing scenario. In fact, last week we got many big misses heading into the NFP report, but the US Jobless Claims showed that the labour market is still fine and the NFP beat expectations. We have also got a jump in the unemployment rate, but it was accompanied by a rise in the participation rate and the average hourly earnings surprised to the downside, which is another good news for inflation. The market doesn’t expect the Fed to hike anymore, so the next stop might be the rate cuts. Historically though, the market falls when the Fed starts to cut rates because those generally come in response to a recession.
Russell 2000 Technical Analysis – Daily Timeframe
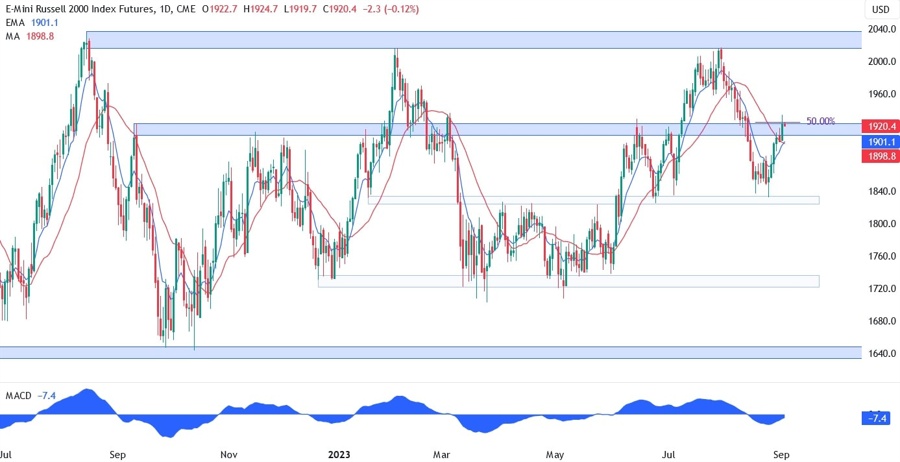
On the daily chart, we can see that the Russell 2000 has bounced on the key 1820 support zone and rallied all the way back to the 1920 resistance area. This will be a strong barrier to crack for the buyers as we have also the confluence with the 50% Fibonacci retracement level. The sellers should pile in here with a defined risk above the resistance to target another fall into the 1820 support and eventually a break lower.
Russell 2000 Technical Analysis – 4 hour Timeframe
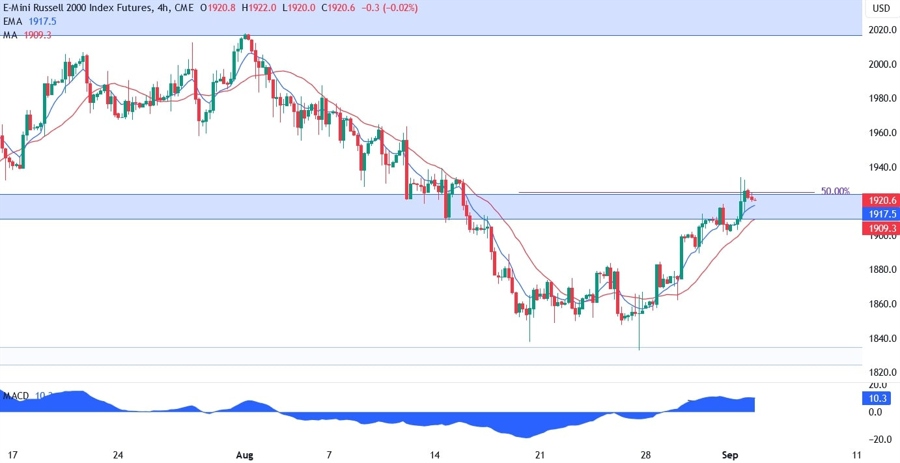
On the 4 hour chart, we can see that the current trend is bullish as the price has been printing higher highs and higher lows and the moving averages are crossed to the upside. The buyers will need the price to break decisively above the resistance to invalidate the bearish setup. Once the way is clear, there is no notable resistance until the previous high at 2020.
Russell 2000 Technical Analysis – 1 hour Timeframe
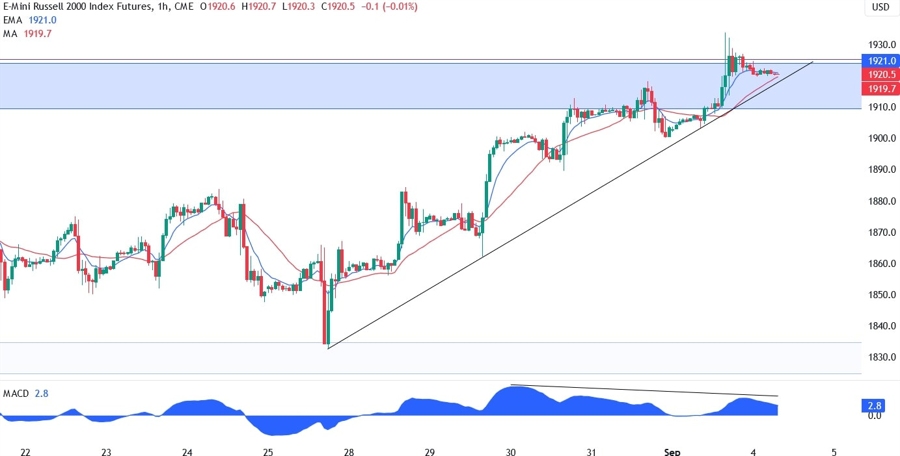
On the 1 hour chart, we can see that we’ve been diverging with the MACD for quite some time and this is generally a sign of weakening momentum often followed by pullbacks or reversals. In this case, the price has been respecting the upward trendline and we can expect the buyers to lean on it again as we have also the confluence with the red 21 moving average. A break below the trendline would confirm the reversal and give the sellers more conviction to target the 1820 support zone.
Upcoming Events
Today is the US Labor Day so the markets will be closed. This week is pretty empty on the data front with just the US ISM Services PMI scheduled for Wednesday and the US Jobless Claims on Thursday. The market has shown strong resilience to weaker data in the past weeks and it’s hard to tell how much bad the data needs to be to bring it down. One thing that held pretty well is the US Jobless Claims, so much worse than expected readings might trigger a selloff.
See also the video below
