Last week the US data surprised to the upside with the ISM Services PMI and Jobless Claims beating expectations by a big margin. The market didn't like the strong data as it raises the chances of another rate hike in November. In fact, the Russell 2000 sold off following the PMI beat and deepened the losses after the beat in Jobless Claims. The market seems to be trading on “good news is bad news” at the moment, so watch out for the data this week.
Russell 2000 Technical Analysis – Daily Timeframe
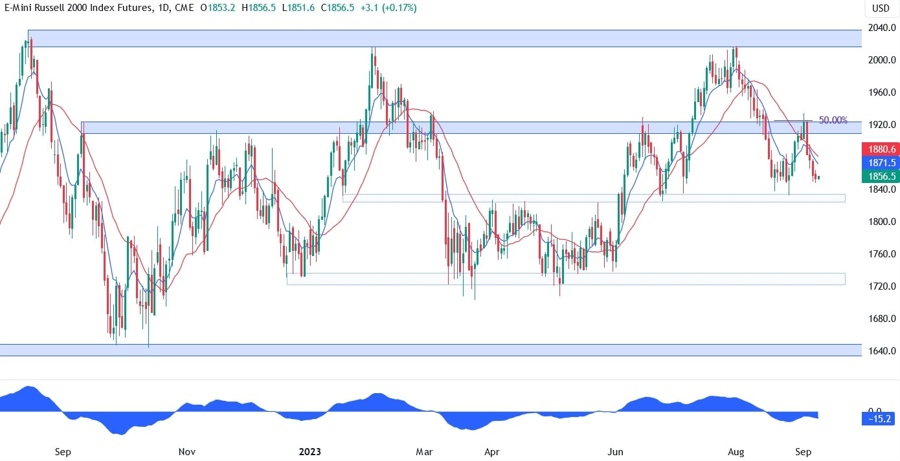
On the daily chart, we can see that the Russell 2000 has been falling steadily from the key resistance at 1920 and it’s now getting close to the key 1820 support zone. This is where we can expect the buyers to step in with a defined risk below the support to target again a rally into the 1920 resistance. A break below the support would give the sellers even more control and take the Russell 2000 into the 1720 level.
Russell 2000 Technical Analysis – 4 hour Timeframe
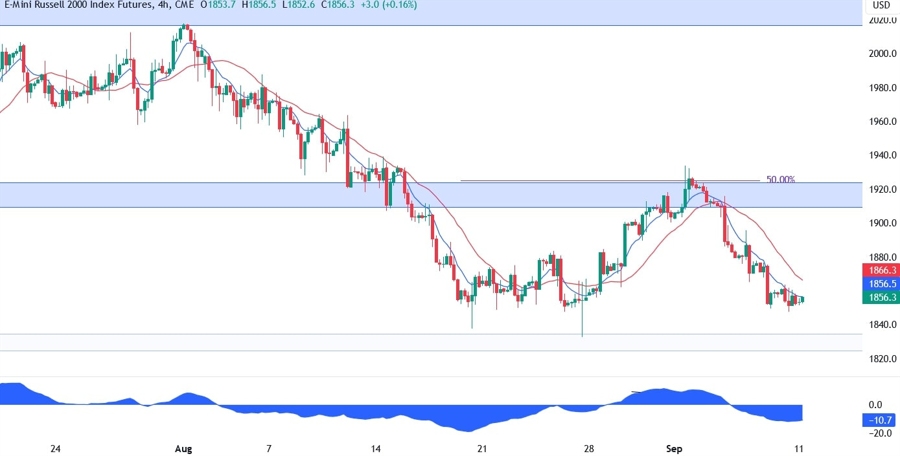
On the 4 hour chart, we can see that the short term trend remains clearly bearish as the price keeps on printing lower lows and lower highs and the moving averages are crossed to the downside. The price started to consolidate recently but we can expect the sellers to lean on the red 21 moving average to position for another selloff into the support zone. If the price breaks above the moving average, the buyers are likely to pile in to extend the rally into the 1920 resistance.
Russell 2000 Technical Analysis – 1 hour Timeframe
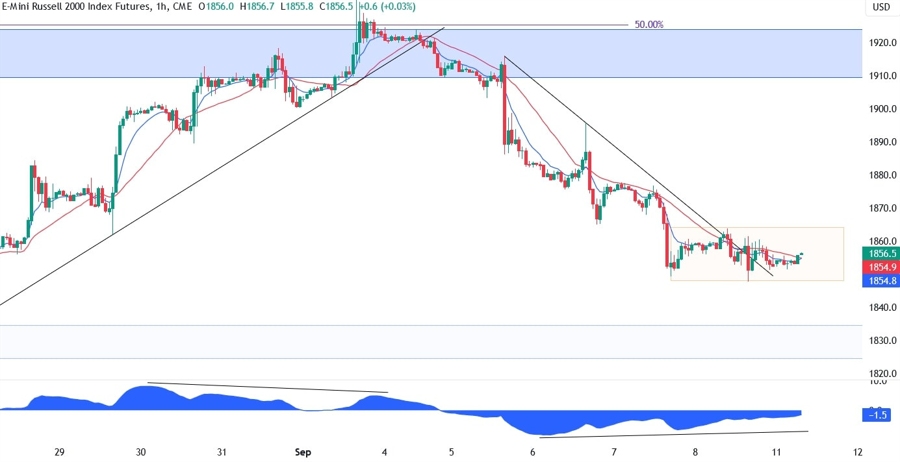
On the 1 hour chart, we can see that the consolidation on the 1850 level led to a breakout of the downward trendline and the price has been diverging with the MACD for some time. This is generally a sign of weakening momentum often followed by pullbacks or reversals. In this case, the levels to watch will be the boundaries of the orange box. A break to the upside should confirm a reversal and lead to a rally into the 1920 resistance. On the other hand, a break to the downside should see more sellers piling in and extend the drop into the 1820 support. More aggressive sellers may want to lean on the upper bound of the range with a tight risk above the level to have a better risk to reward setup.
Upcoming Events
This week is likely to be a volatile one given the release of top tier economic indicators including the US CPI. In fact, on Wednesday we get the US CPI report, which is expected to show an acceleration in the headline inflation but a deceleration in the core measure. On Thursday, we get the US PPI, Retail Sales and Jobless Claims data. Finally, we conclude the week with the University of Michigan Consumer Sentiment report on Friday.
