Last Friday, the Russell 2000 pulled back from the cycle high as a hot US PPI report weighed on the market. In fact, the Treasury yields rose, and the rate cuts expectations got trimmed some more as fears of stickier inflation started to creeping in. The Fed members though keep on dismissing the latest figures as something expected and continue to repeat that the disinflationary trend remains intact. This suggests that the Fed is not even considering rate hikes and in the worst-case scenario could just delay rate cuts. The market might continue to like this as long as the economic data remains good. Today the market will be closed for the Presidents Day and will resume trading tomorrow.
Russell 2000 Technical Analysis – Daily Timeframe
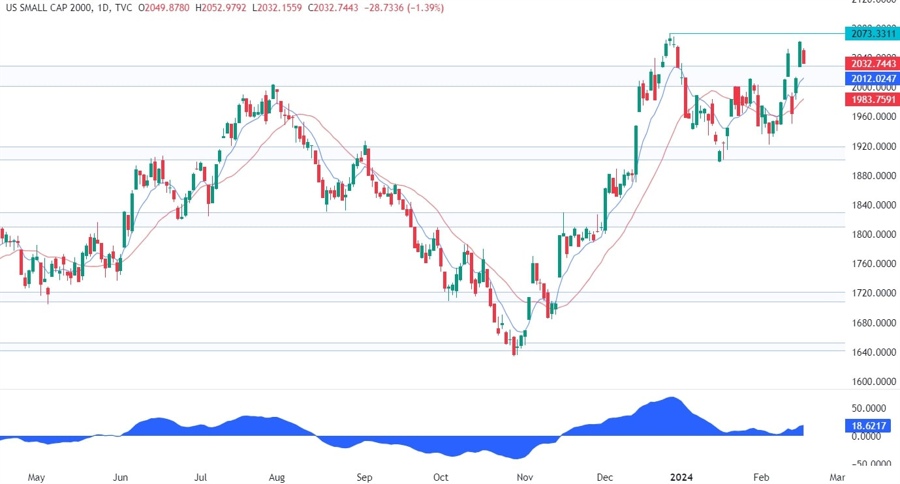
On the daily chart, we can see that the Russell 2000 broke through the key resistance once again as the buyers are trying to set a new high. We can see that the price has been printing higher lows recently, so the buyers are clearly in control but another rejection from the highs could end up in a double top, which is something that the sellers will watch very carefully.
Russell 2000 Technical Analysis – 4 hour Timeframe
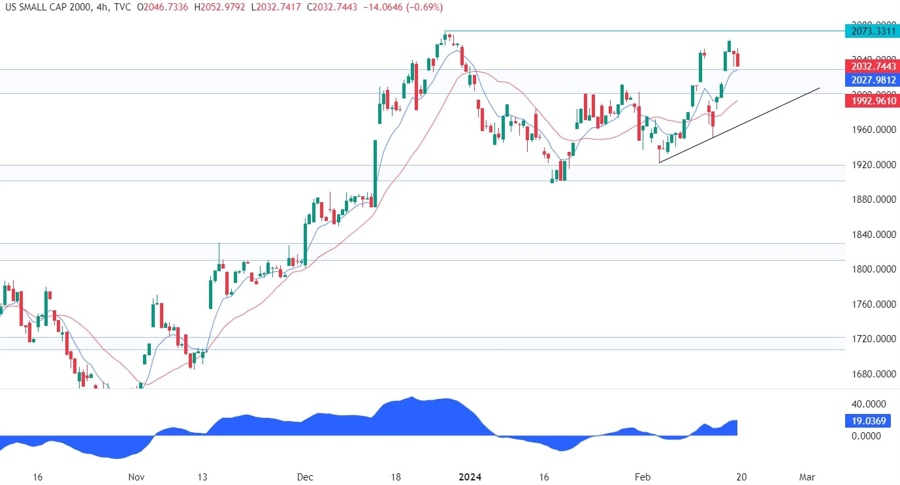
On the 4 hour chart, we can see that the market fell into the close last Friday with the price now right at the key resistance zone. This is where the buyers are likely to step in with a defined risk below the zone to position for a rally into a new high. Alternatively, the buyers will have an even better opportunity, from a risk to reward perspective, around the trendline.
Russell 2000 Technical Analysis – 1 hour Timeframe
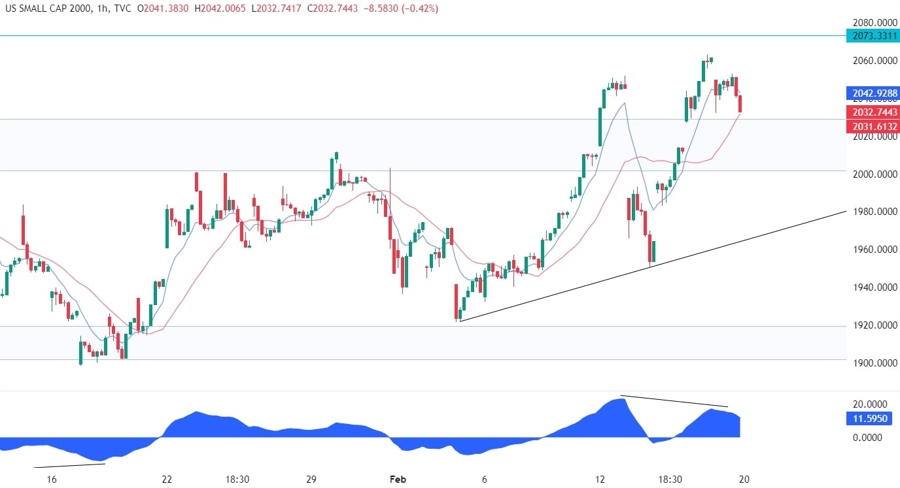
On the 1 hour chart, we can see that the latest leg higher diverged with the MACD which is generally a sign of weakening momentum often followed by pullbacks or reversals. In this case, it might be another sign of a bigger pullback into the trendline.
Upcoming Events
This week is basically empty on the data front with just the release of the FOMC Meeting Minutes on Wednesday followed by the US Jobless Claims and the US PMIs on Thursday.
