Yesterday, the Russell 2000 rallied strongly erasing all the losses from the hot US CPI release. It looks like the market can look through some higher-than-expected inflation prints as long as growth remains stable, and the Fed doesn’t embark on another tightening process. Therefore, it might be better to focus more on growth related data rather than inflation figures unless there’s a serious reacceleration in inflation that forces the Fed to reverse course and hike rates again.
Russell 2000 Technical Analysis – Daily Timeframe
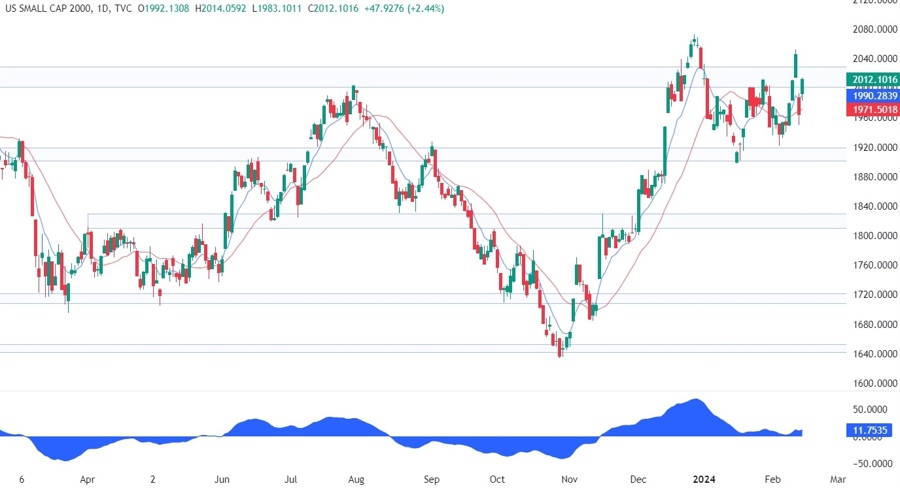
On the daily chart, we can see that the Russell 2000 broke through the key resistance on Monday but got smacked back down on Tuesday following the hot US CPI report. The market yesterday managed to rally again and it’s now testing the resistance. It looks like there’s going to be a strong battle here between buyers and sellers with the former targeting a breakout and the latter aiming for a selloff back into the support.
Russell 2000 Technical Analysis – 4 hour Timeframe
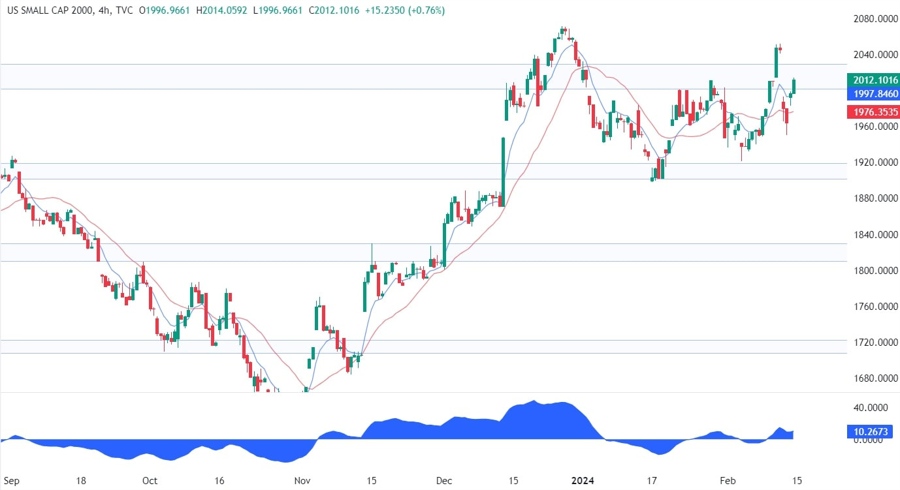
On the 4 hour chart, we can see that the price action has pretty choppy and erratic between the resistance and the support. There’s not much to do here other than waiting for a clear breakout or “playing the range” by buying at support and selling at resistance.
Russell 2000 Technical Analysis – 1 hour Timeframe
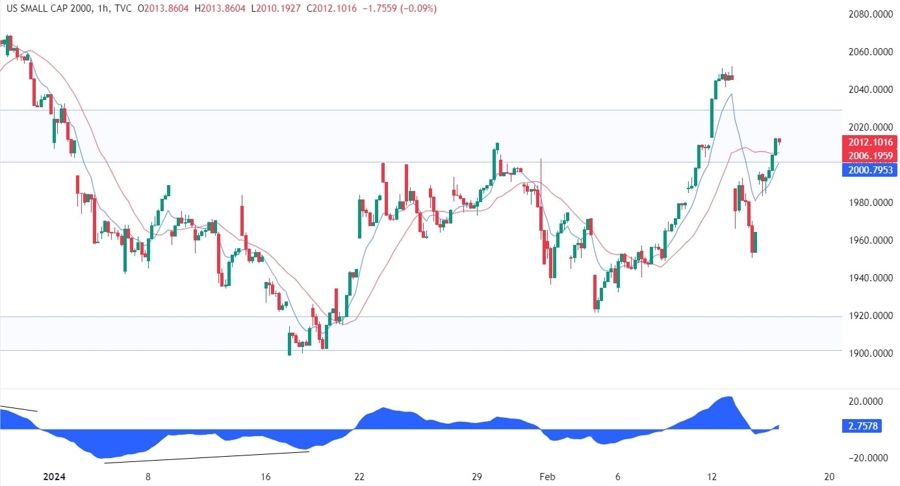
On the 1 hour chart, we can see that although the price action has been rangebound, the market kept on printing higher highs and higher lows which could be a sign that the buyers might be able to break above the resistance eventually and extend the rally into new highs.
Upcoming Events
Today we will see the latest US Jobless Claims figures and the US Retail Sales data, while tomorrow we conclude the week with the US PPI and the University of Michigan Consumer Sentiment survey.
