Yesterday, the Russell 2000 closed the day negative once again lagging the other major indexes as they get pushed to new highs by the Mag7 stocks. This week was basically uneventful with just the ISM Services PMI being the only notable release and, although it surprised to the upside across the board, the jump in prices paid index could be a worrying signal. Today we will see the latest US Jobless Claims figures and then the calendar is empty until the US CPI next Tuesday. The market should start to think about how it wants to position itself into the inflation report.
Russell 2000 Technical Analysis – Daily Timeframe
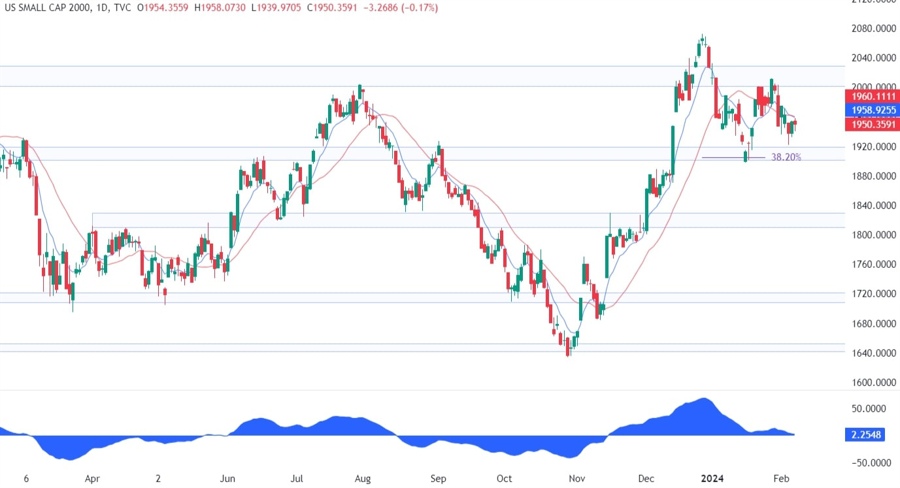
On the daily chart, we can see that the Russell 2000 continues to trade in the range between the 1920 support and 2020 resistance. The price is now near the key support so we can expect the buyers to step in with a defined risk below the level to target a rally into the 2020 resistance.
Russell 2000 Technical Analysis – 4 hour Timeframe
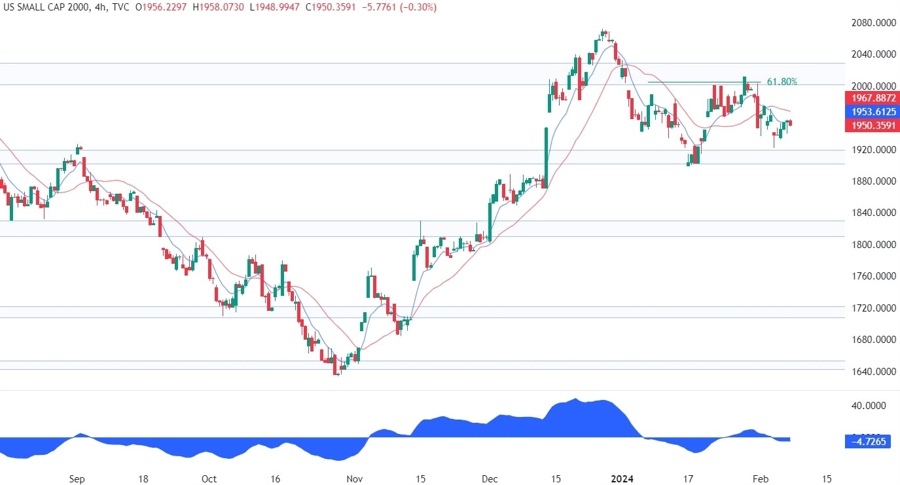
On the 4 hour chart, we can see that there’s nothing to do here other than waiting for the price to reach the key levels and “play the range” by buying at support and selling at resistance. It will also be important to keep an eye on eventual breakouts as they can trigger strong moves after such long consolidations.
Russell 2000 Technical Analysis – 1 hour Timeframe
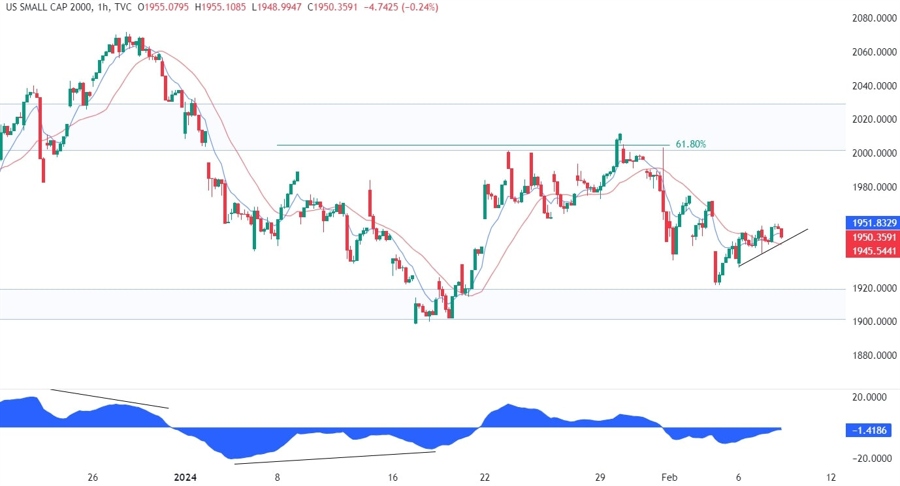
On the 1 hour chart, we can see that we have a minor upward trendline defining the current short term uptrend. The buyers might want to lean on it to keep bidding the price into the resistance, while the sellers will want to see the price breaking lower to increase the bearish bets into the support and target a break below it.