Last Friday, the Russell 2000 closed the day positive following a surprisingly strong NFP report. The headline number was much higher than even the most optimistic estimates with the unemployment rate ticking lower. There were also some bad things though like the plunge in Average Weekly Hours which contributed to push higher Average Hourly Earnings and the Household survey showing job losses for the second consecutive month.
In fact, even Fed’s Goolsbee mentioned this detail saying that “despite the brisk hiring numbers, weakness in overall hours worked suggests that this wasn’t as strong as that headline number suggested. There are big seasonal adjustments in January and the data might have been distorted a bit which makes trusting this report a little harder.
Russell 2000 Technical Analysis – Daily Timeframe
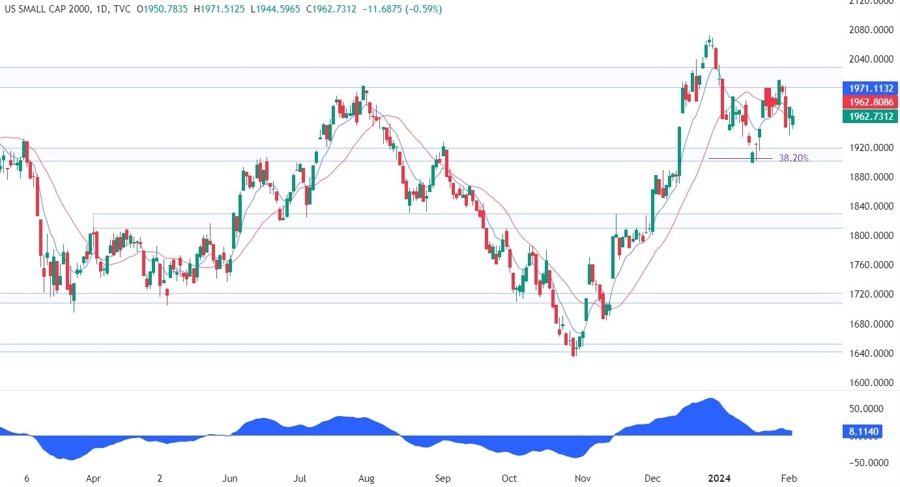
On the daily chart, we can see that the Russell 2000 continues to trade in the range between the 1920 support and 2020 resistance. The price recently bounced on the support and rallied into the resistance where it got rejected as the sellers stepped in once again to target a drop back into the support and looking for a breakout to the downside.
Russell 2000 Technical Analysis – 4 hour Timeframe
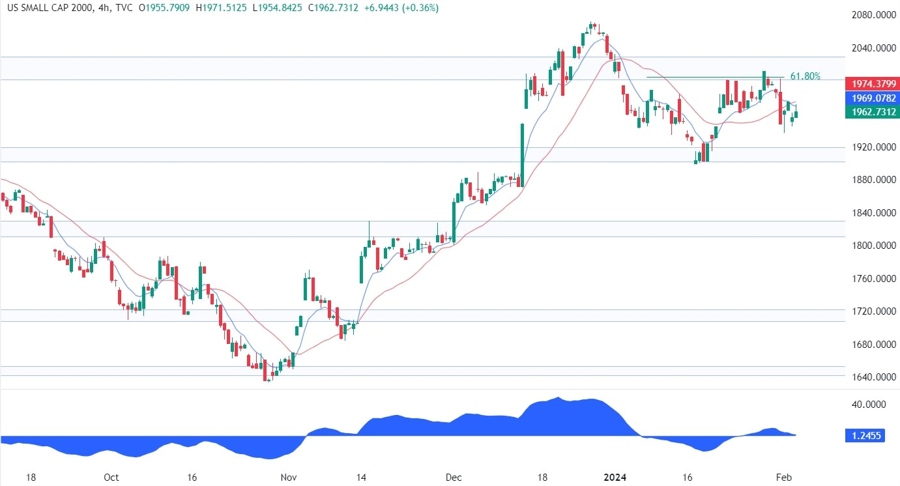
On the 4 hour chart, we can see more clearly that the price got rejected from the resistance where we had also the 61.8% Fibonacci retracement level for confluence. The buyers should now wait for the price to fall into the 1920 support where they will likely pile in with a defined risk below the level to position for a rally into the resistance and target a breakout to the upside.
Russell 2000 Technical Analysis – 1 hour Timeframe
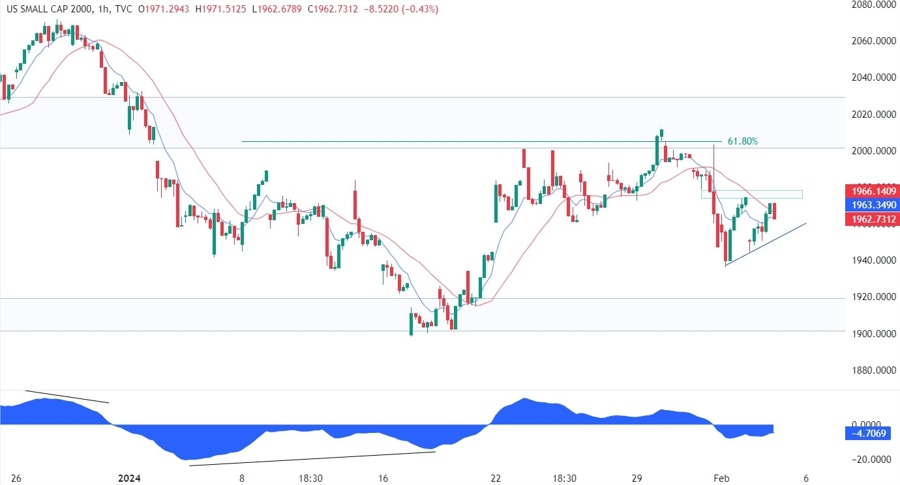
On the 1 hour chart, we can see that we have a minor resistance zone around the 1974 level where we have also the red 21 moving average for confluence. The sellers leant on this resistance and we can expect them to increase the bearish bets on a break below the upward trendline. The buyers, on the other hand, will want to see the price reversing and breaking above the 1974 resistance to pile in and target the 2020 resistance.
Upcoming Events
This week is basically empty on the data front with just a couple of key economic releases. Today we have the US ISM Services PMI where the market will likely focus on the employment index given the big drop last month. On Thursday, we will see the latest US Jobless Claims figures where the market will want to see if the resilience in the labour market remains intact.