Last Friday, the Russell 2000 finished the day basically unchanged after the release of two key economic reports. The US NFP report beat expectations, with the market initially trimming rate cuts expectations and spiking downwards, but after a couple of minutes, the price reversed as under the hood the data wasn’t as good as it seemed. Sometime later, we got the release of the ISM Services PMI and that’s where the real shocker came from.
Besides the data missing across the board, the employment sub-index cratered to levels seen only in the dot-com recession, the global financial crisis and the covid recession. Although the market might keep on cheering about the upcoming rate cuts, these are bearish signals and they are coming right around the stock market highs, so the bulls should start to get extra careful going forward.
Russell 2000 Technical Analysis – Daily Timeframe
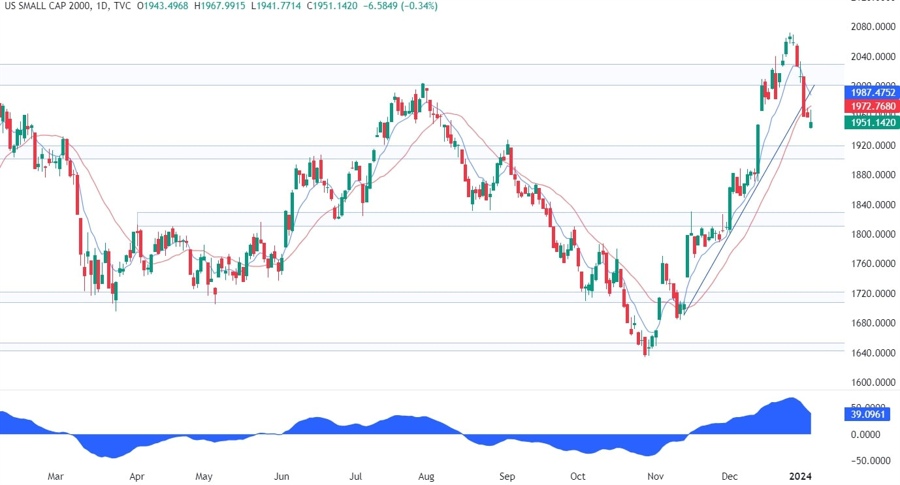
On the daily chart, we can see that the Russell 2000 last Friday finished the day basically unchanged. The price is now approaching a key support zone around the 1920 level and that’s where we can expect the buyers to step in with a defined risk below the support to position for a rally back into the highs. The sellers, on the other hand, will want to see the price breaking lower to invalidate the bullish setup and extend the selloff into the 1820 support.
Russell 2000 Technical Analysis – 4 hour Timeframe
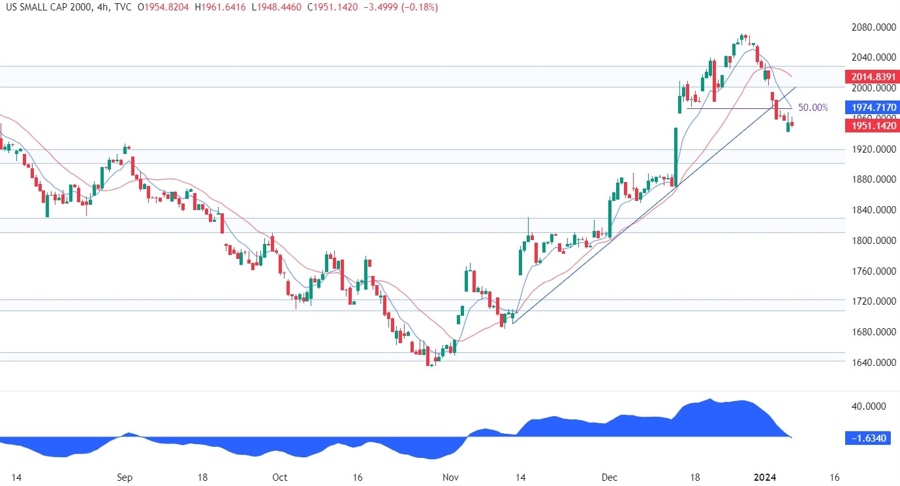
On the 4 hour chart, we can see that the price broke a strong support zone around the trendline where we had the confluence with the 50% Fibonacci retracement level and the daily 21 moving average. This should be a signal that the downside momentum remains strong and the next level to look at is the support around the 1920 level.
Russell 2000 Technical Analysis – 1 hour Timeframe
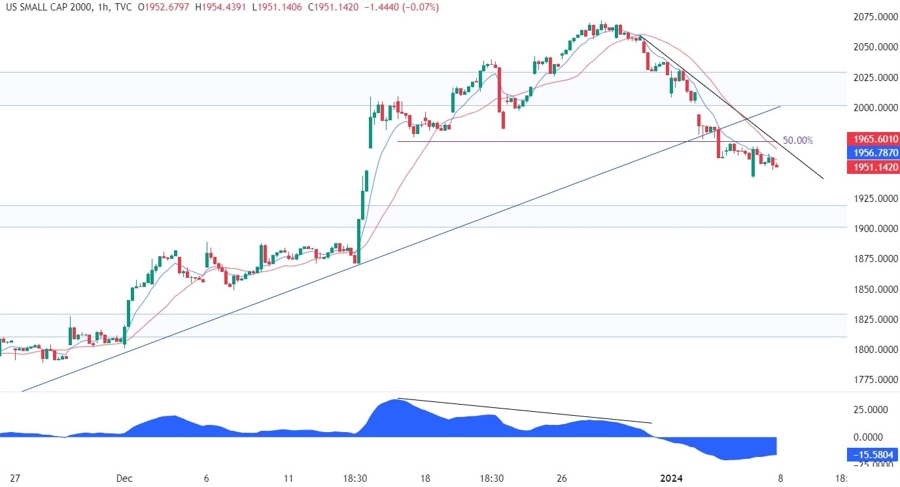
On the 1 hour chart, we can see that the breakout diverged with the MACD which is generally a sign of weakening momentum often followed by pullbacks or reversals. In this case, we got a pullback into the trendline, but the break below it invalidated the bullish setup and confirmed a reversal. It looks like the breakout of the range was just a fakeout, which is generally a reversal pattern. From a risk management perspective, late sellers might want to wait for a pullback into the downward trendline and the red 21 moving average to position for a drop into the 1920 support.
Upcoming Events
This week is basically empty on the data front with the only two notable releases scheduled for Thursday when we will get the US CPI report and the US Jobless Claims figures.
