Yesterday, the Russell 2000 remained on the back foot as the correction that began last week seems to have more room to go. As of now, the data has been overall positive with the US ISM Manufacturing PMI beating expectations and US Job Openings missing forecasts. Moreover, yesterday we got a beat in the US ADP and US Jobless Claims data. If the data remains positive, we can expect the market to bounce back once the froth from the aggressive rate cuts expectations gets unwound. Today, is an important day as we get the release of the US NFP and the US ISM Services PMI.
Russell 2000 Technical Analysis – Daily Timeframe
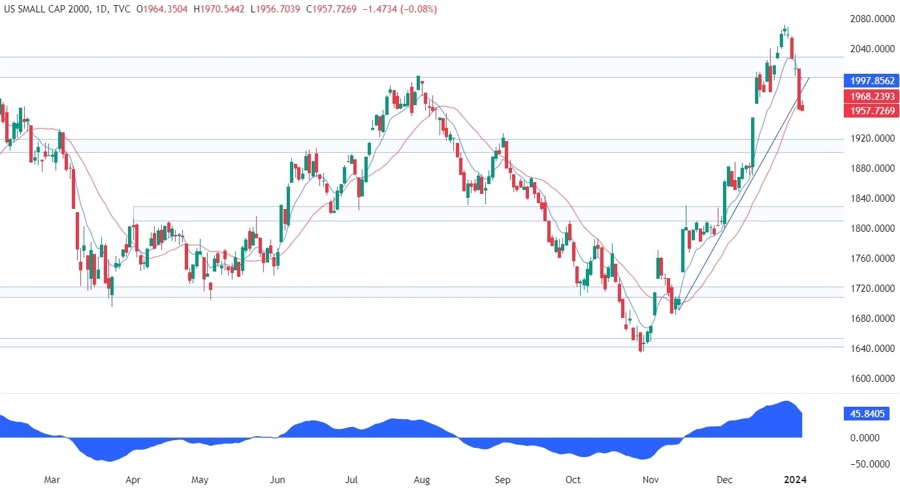
On the daily chart, we can see that the Russell 2000 extended the correction that began last week with the price breaking below the key trendline and opening the door for a drop into the 1920 support zone. That’s where we can expect the buyers to step in with a defined risk below the support to position for new highs.
Russell 2000 Technical Analysis – 4 hour Timeframe
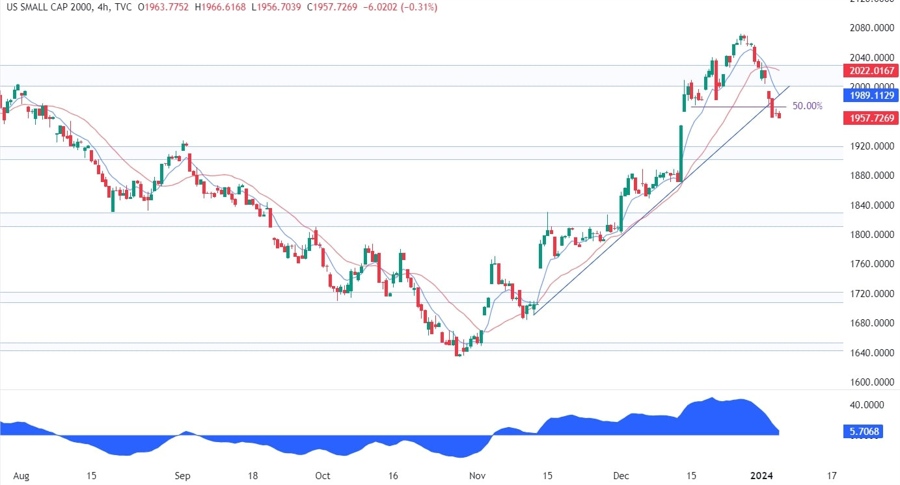
On the 4 hour chart, we can see that the price broke a strong support zone around the trendline where we had the confluence with the 50% Fibonacci retracement level and the daily 21 moving average. This should be a signal that the downside momentum remains strong and the next level to look at is the support around the 1920 level.
Russell 2000 Technical Analysis – 1 hour Timeframe
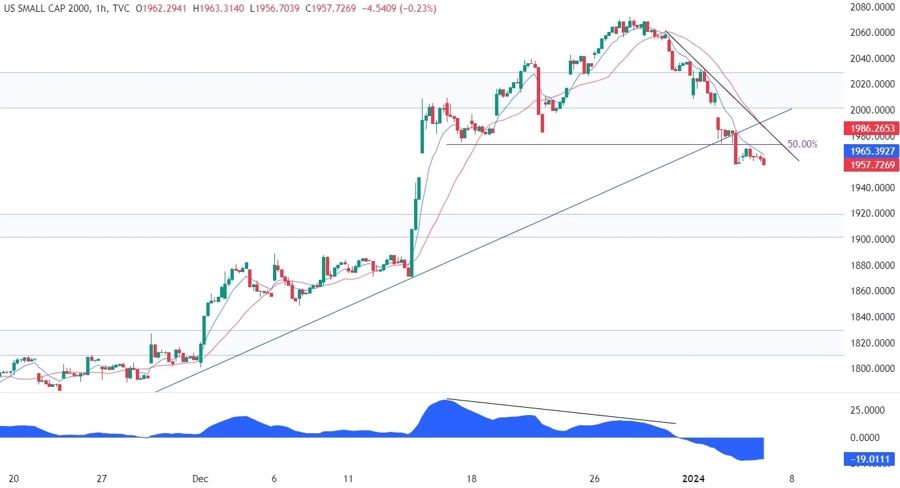
On the 1 hour chart, we can see that the breakout diverged with the MACD which is generally a sign of weakening momentum often followed by pullbacks or reversals. In this case, we got a pullback into the trendline, but the break below it invalidated the bullish setup and confirmed a reversal. From a risk management perspective, late sellers might want to wait for a pullback into the downward trendline to position for a drop into the 1920 support.
