Last week, we saw a bit of a Christmas rally in the Russell 2000, although all the gains got erased in the final couple of days. The market is all-in on the soft-landing trade with the Fed expected to cut interest rates soon, the labour market coming into better balance and the inflation rate on track to reach the 2% target by the end of the year. It’s hard for the bears to fight the current positive sentiment, especially without significant bearish catalysts, but such crowded trades are generally liable to fast unwinding in case the prevailing narrative proves to be wrong, so the bulls should be extra careful going forward.
Russell 2000 Technical Analysis – Daily Timeframe
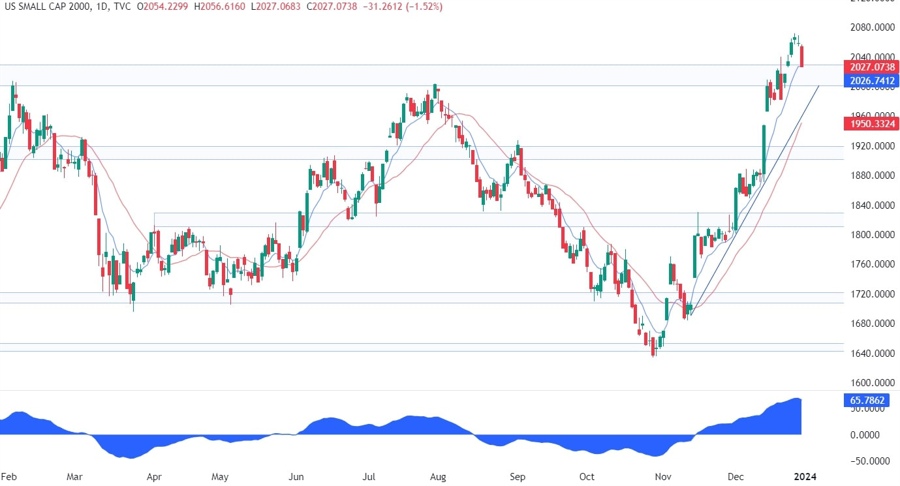
On the daily chart, we can see that the Russell 2000 last week broke above the top of the long-term range although the rally lost momentum very quickly. From a risk management perspective, the buyers would be better off waiting for a pullback into the trendline where they will also find the red 21 moving average for confluence. The sellers, on the other hand, will look at this pullback with high interest as a break below the trendline could confirm the fakeout, which is generally a reversal pattern.
Russell 2000 Technical Analysis – 4 hour Timeframe
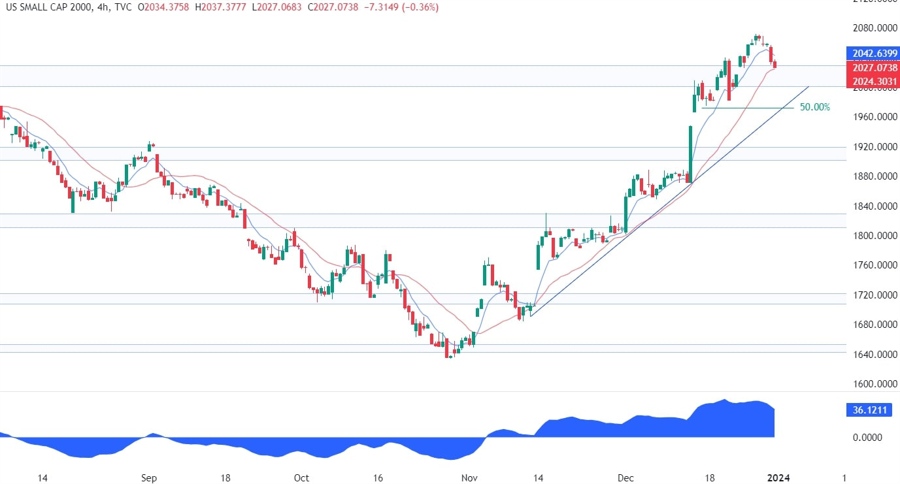
On the 4 hour chart, we can see that we have some more confluence around the trendline as we can also find the 50% Fibonacci retracement level and the most recent swing low around the 1975 level. That’s where the buyers will likely position for a rally with a defined risk below the trendline, while the sellers will want to see the price breaking lower to invalidate the bullish setup and pile in for a drop into new lows.
Russell 2000 Technical Analysis – 1 hour Timeframe

On the 1 hour chart, we can see that the recent leg higher diverged with the MACD which is generally a sign of weakening momentum often followed by pullbacks or reversals. In this case, we are indeed witnessing a pullback which increases the chances of seeing the price falling right into the trendline where things will get more interesting.
Upcoming Events
This week is full of key economic data which will culminate with the NFP report on Friday. We begin tomorrow with the ISM Manufacturing PMI and Job Openings and given the recent trends there could be room for disappointment. Later in the day, we will get the release of the FOMC Minutes, but it’s not expected to be market-moving given that it’s three weeks old data. On Thursday, we will have another slate of US labour market data with the release of the US ADP and Jobless Claims figures. Finally, on Friday, we conclude the week with the NFP report and the ISM Services PMI.