Yesterday, the Fed kept interest rates unchanged as expected but that's not what the market was looking for going into the event. The market was focused solely on the Dot Plot and the Fed decided to validate the market's dovish pricing projecting a 2024 year-end peak rate at 4.6%. The expectations were for the Fed to keep two rate cuts for 2024, but the Fed decided to increase that to three, basically agreeing with the market that rate cuts are coming.
Moreover, Fed Chair Powell didn't push back against the strong dovish pricing and even said that they are focused on not making the mistake of holding rates high for too long, which suggests that a rate cut could come pretty soon. This gave a strong boost to the Russell 2000 leading to new highs with the sentiment turning heavily bullish.
Russell 2000 Technical Analysis – Daily Timeframe
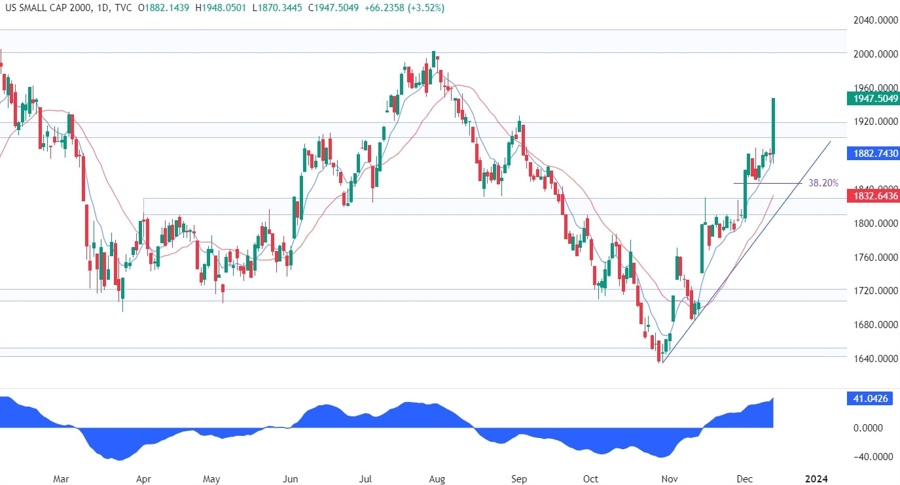
On the daily chart, we can see that the Russell 2000 broke above the key 1920 resistance zone following the Fed’s pivot and it’s now eyeing the next resistance around the 2020 level. On this timeframe, we have a good bullish setup at the trendline where we can find the confluence with the 38.2% Fibonacci retracement level and the red 21 moving average. That’s where we can expect the buyers to lean on if the price pulls back all the way down to the trendline.
Russell 2000 Technical Analysis – 4 hour Timeframe
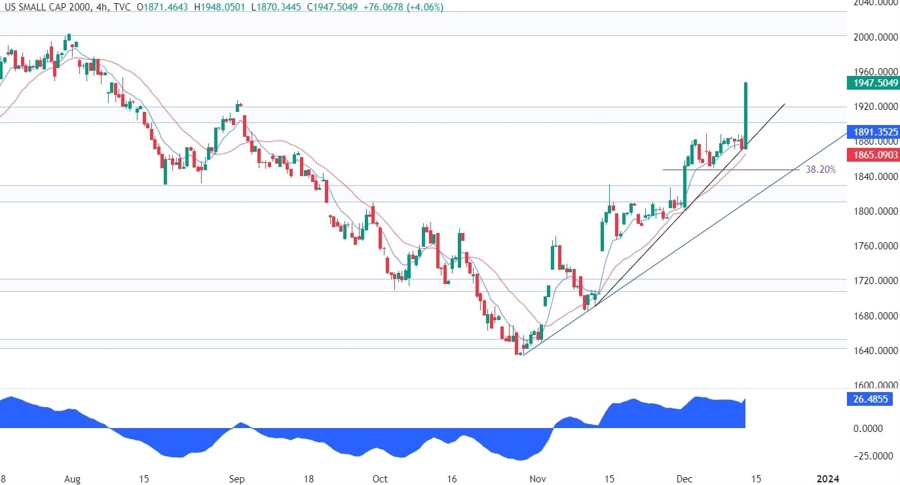
On the 4 hour chart, we can see that we have another minor trendline on this timeframe where the buyers leant onto to position for a break above the key resistance zone. For now, the bias remains bullish, so the buyers will look for another pullback into the minor trendline to position for a rally into the 2020 resistance. The sellers, on the other hand, will want to see the price breaking below the minor trendline to pile in and target a drop into the major trendline.
Russell 2000 Technical Analysis – 1 hour Timeframe
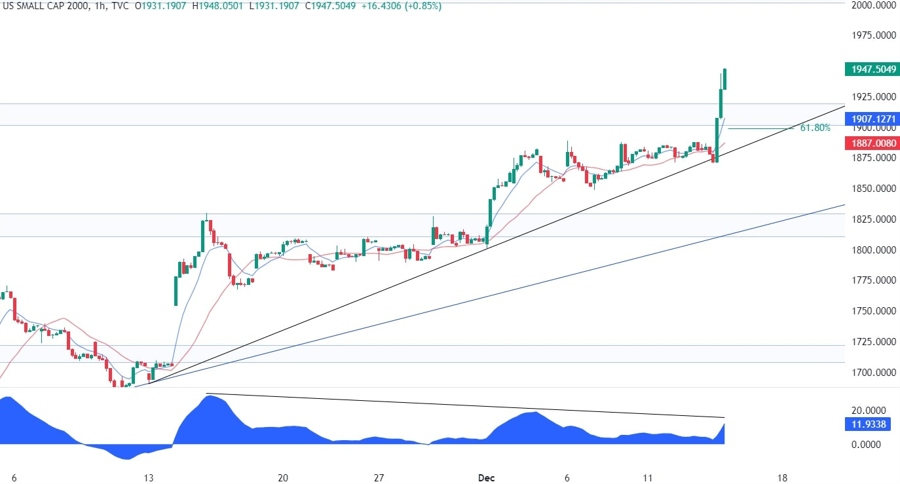
On the 1 hour chart, we can see that the Russell 2000 has been diverging with the MACD for quite some time. This is generally a sign of weakening momentum often followed by pullbacks or reversals. In this case, we only got the pullbacks, and we can expect this trend to continue as long as the price stays above the trendline. We can also see that on this timeframe we have the 61.8% Fibonacci retracement level right around the minor trendline, which adds another layer of confluence for the buyers in case the price pulls back.
Upcoming Events
Today we will see the latest US Retail Sales and Jobless Claims figures, while tomorrow we conclude the week with the US PMIs.
