Last Friday, the NFP report beat expectations across the board with the unemployment rate falling to 3.7% vs. 3.9% previously and the average hourly earnings on a monthly basis higher than expected at 0.4%. The jobs data was followed by a strong University of Michigan Consumer Sentiment survey where inflation expectations fell much more than expected.
Overall, it was a good day for those in the soft-landing camp, but it also raised the risk of a hawkish FOMC rate decision on Wednesday as the Fed might push against rate cuts expectations more strongly. The Russell 2000 continues to consolidate at the highs as there might not be that much of an incentive to keep pushing ahead of this week's risk events.
Russell 2000 Technical Analysis – Daily Timeframe
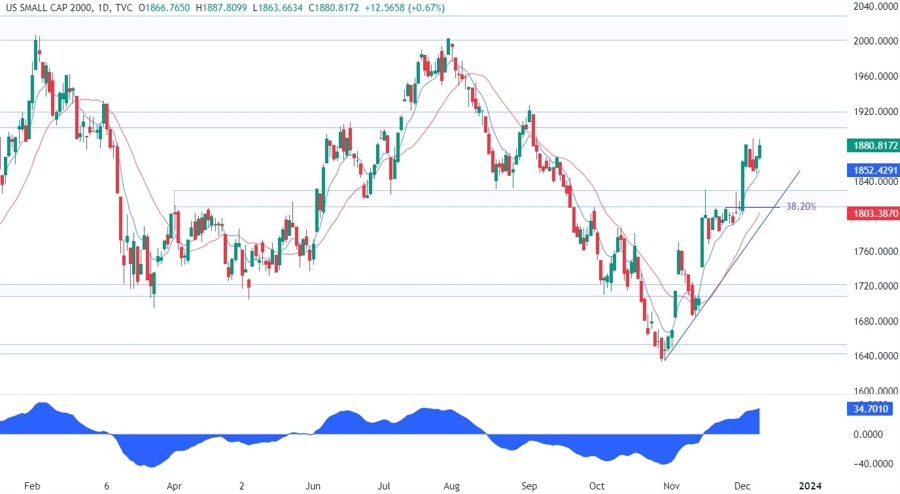
On the daily chart, we can see that the Russell 2000 had a positive day last Friday following the soft-landing data releases but failed to make a new high. From a risk management perspective, the buyers would have a better risk to reward setup at the previous resistance now turned support around the 1820 level where we can also find the confluence with the trendline, the red 21 moving average and the 38.2% Fibonacci retracement level. The sellers, on the other hand, will want to see the price breaking below the trendline to invalidate the bullish setup and position for a drop into the 1720 support.
Russell 2000 Technical Analysis – 4 hour Timeframe
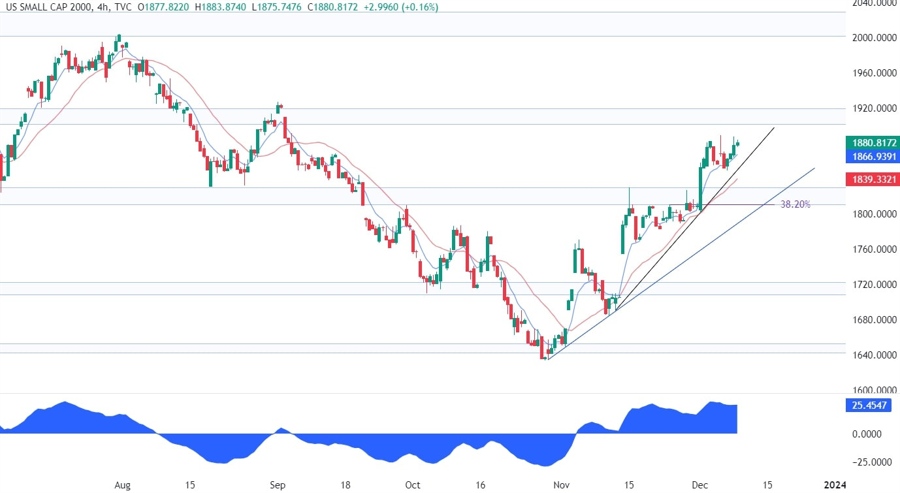
On the 4 hour chart, we can see that we have another minor trendline on this timeframe where the buyers could lean onto with the red 21 moving average adding extra confluence. The sellers are likely to step in at the 1920 resistance zone with a defined risk above it to position for a drop into the 1820 support. A break below the minor trendline should see the sellers increasing their bearish bets into the support.
Russell 2000 Technical Analysis – 1 hour Timeframe
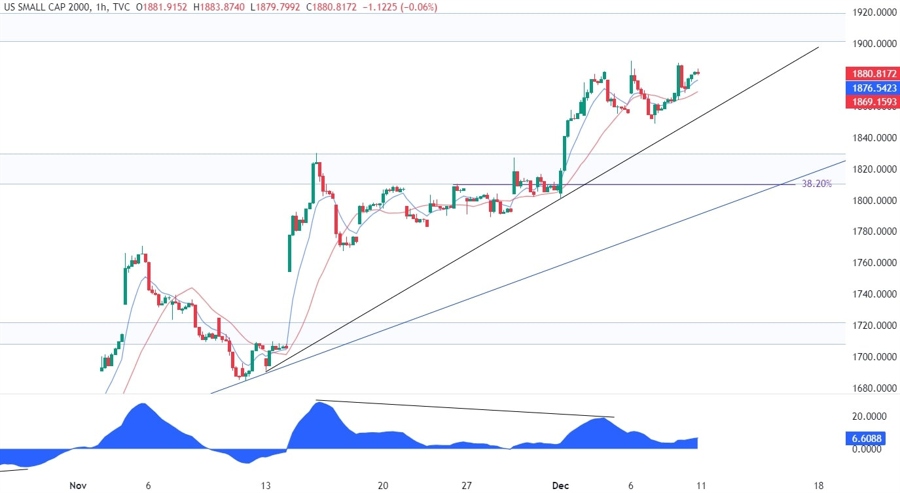
On the 1 hour chart, we can see that the latest move higher diverged with the MACD which is generally a sign of weakening momentum often followed by pullbacks or reversals. In this case, as long as the price stays above the trendlines, we will be in the pullback zone, but if the price breaks the major trendline, a reversal would be confirmed, and the sellers will regain control. Watch out also for one last rally into the 1920 resistance as that could make the divergence even stronger and give the sellers another bearish confirmation to target the 1820 support.
Upcoming Events
This week is going to be a big one with the US CPI and the FOMC rate decision on the agenda. We begin tomorrow with the release of the US CPI report where the market will want to see how the disinflationary trend is going. On Wednesday, we have the US PPI data followed by the FOMC rate decision where the Fed is expected to keep interest rates unchanged. On Thursday, we will see the US Retail Sales and Jobless Claims figures, while on Friday we conclude the week with the US PMIs.
