The Russell 2000 couldn't break above the key resistance zone despite a less hawkish Fedspeak and increased rate cuts expectations. One good reason might be the weakening of US data, especially on the labour market side, as we have also seen recently in the details of the US Consumer Confidence report. Historically, the sustained rise in the unemployment rate is bearish for the stock market.
Russell 2000 Technical Analysis – Daily Timeframe
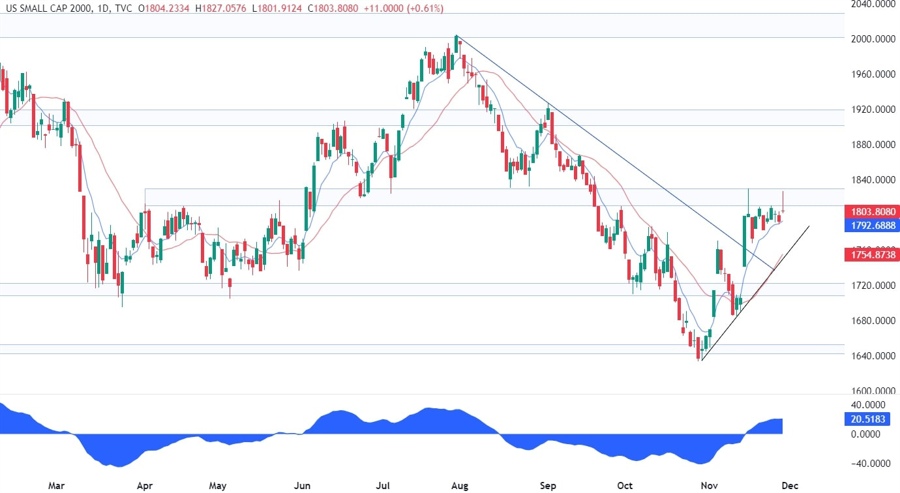
On the daily chart, we can see that the Russell 2000 rejected once again the key resistance around the 1820 level ending the day with a shooting star candlestick. This is generally a reversal pattern, and it comes at a strong resistance, which raises the odds for a move lower. The first target for the sellers should be the upward trendline around the 1750 level where the buyers will likely step in with a defined risk below the trendline to position for another rally into the resistance and aiming for a breakout.
Russell 2000 Technical Analysis – 4 hour Timeframe
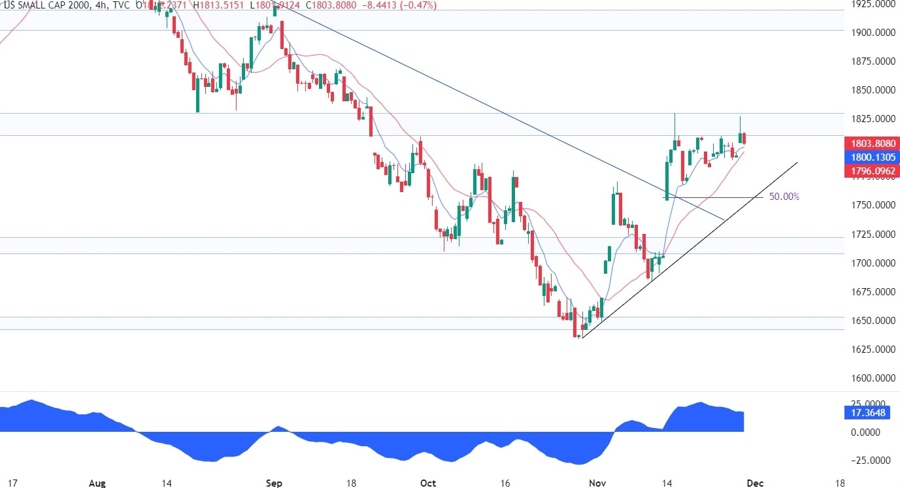
On the 4 hour chart, we can see that from a risk management perspective, the buyers will have a much better risk to reward setup at the trendline where we can also find the 50% Fibonacci retracement level and the daily red 21 moving average for confluence. A break below the trendline would invalidate the bullish setup and likely trigger a selloff with the sellers increasing their bearish bets.
Russell 2000 Technical Analysis – 1 hour Timeframe
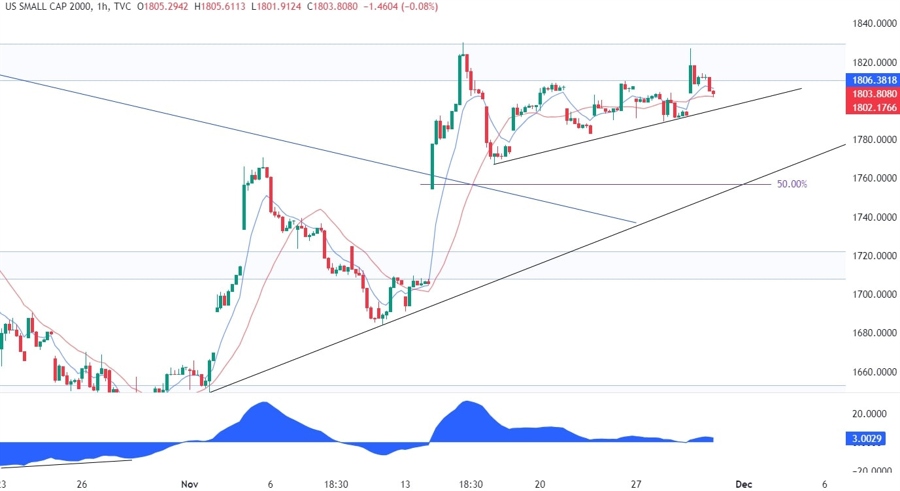
On the 1 hour chart, we can see that we have a minor trendline that defined the consolidation below the key resistance. Some aggressive buyers might lean on this trendline to target a break above the key resistance. The sellers, on the other hand, will want to see the price breaking lower to increase their bearish bets into the major trendline.
Upcoming Events
Today we will get the US PCE and US Jobless Claims data with the market likely focusing more on the Jobless Claims figures given that we already saw the latest inflation data with the US CPI report just two weeks ago. Tomorrow, we conclude the week with the US ISM Manufacturing PMI which missed expectations by a big margin the last time.
