The Russell 2000 this week held into last week's gains as the lack of economic releases and the Thanksgiving Day holiday contributed to a steady risk sentiment. On the data front, the US Jobless Claims on Wednesday beat expectations across the board, which is a good thing for the market at the moment given some recession fears, although one beat after a series of misses doesn’t change the trend. Today, all eyes will be on the US PMIs, but given the early closure for Black Friday we might not see much movement, unless the data surprises.
Russell 2000 Technical Analysis – Daily Timeframe
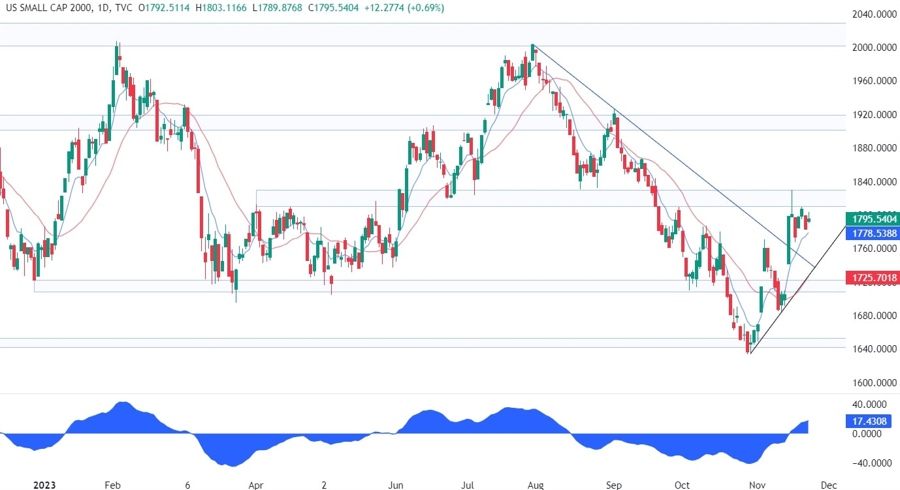
On the daily chart, we can see that the Russell 2000 rejected the key resistance zone around the 1820 level and started to consolidate just beneath it. We can expect the sellers to pile in around these levels to position for a pullback into the upward trendline. The buyers, on the other hand, should lean on the trendline and the red 21 moving average to target a break above the key resistance.
Russell 2000 Technical Analysis – 4 hour Timeframe
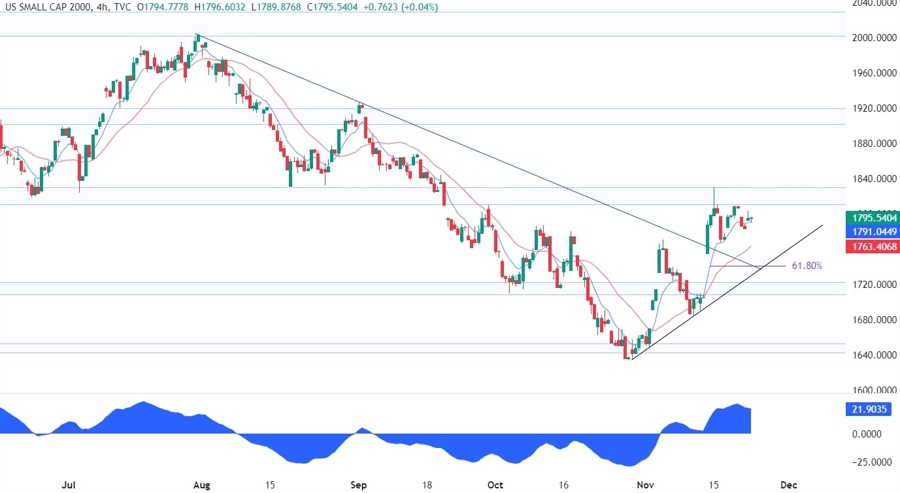
On the 4 hour chart, we can see that from a risk management perspective, the buyers will have a much better risk to reward setup at the trendline where we can also find the 61.8% Fibonacci retracement level for confluence. A break below the trendline would invalidate the bullish setup and likely trigger a selloff as the bearish momentum will likely increase with the buyers folding and the sellers increasing their bets.
Russell 2000 Technical Analysis – 1 hour Timeframe
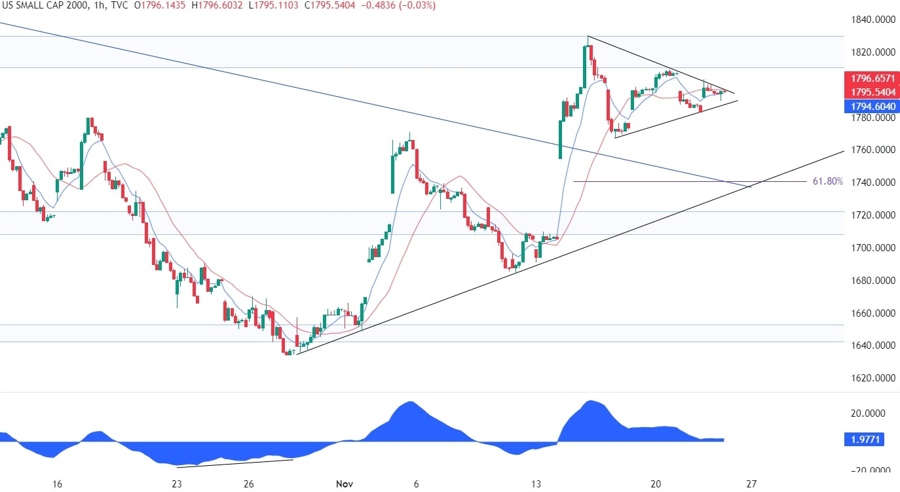
On the 1 hour chart, we can see that the recent price action has formed what looks like a symmetrical triangle right at the key resistance zone. The price can break on either side of the pattern but what follows next is generally a sustained move in the direction of the breakout. In this case, more aggressive buyers might want to pile in already on an upside breakout to target a break above the key resistance. The sellers, on the other hand, will want to see the price breaking lower as it would increase even more the chances for a pullback into the trendline.
