The Russell 2000 ended last week on a positive note as we got a strong rally despite some concerning data. The University of Michigan consumer sentiment report missed forecasts across the board by a big margin once again. The bearish signs keep on accumulating with the recent hawkish tone from Fed speakers and the softening labour market data with the big misses in the recent NFP report and the rising Continuing Claims. The buyers should be very careful going forward.
Russell 2000 Technical Analysis – Daily Timeframe
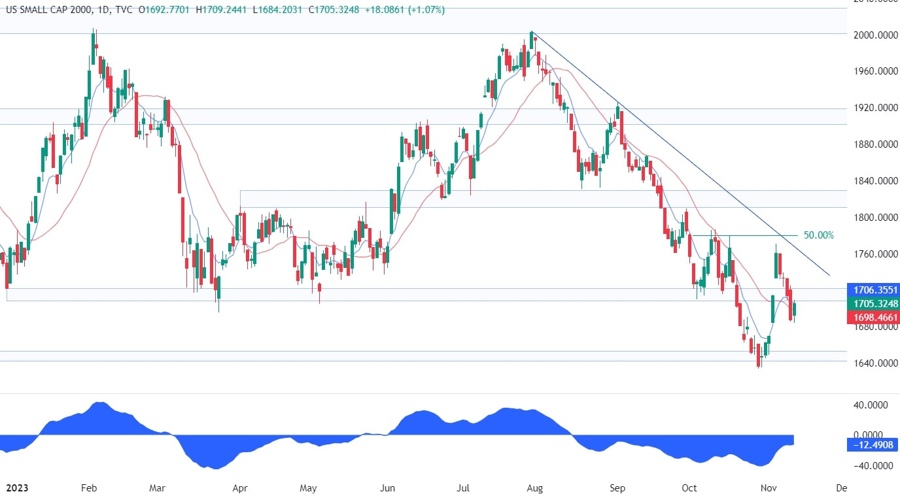
On the daily chart, we can see that the Russell 2000 couldn’t bounce on the key support zone around the 1720 level and fell right through it. The sellers should gain more conviction now and possibly fade the last week’s rally targeting a drop back into the lows.
Russell 2000 Technical Analysis – 4 hour Timeframe
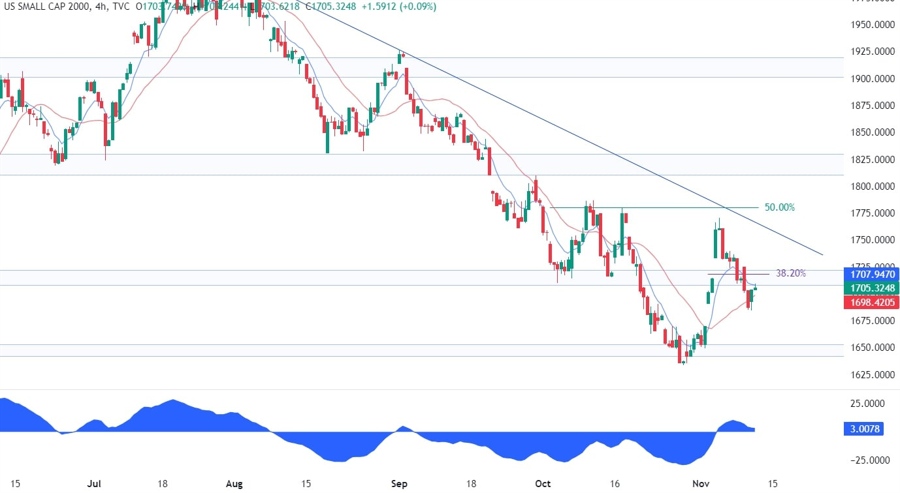
On the 4 hour chart, we can see that we had also the 38.2% Fibonacci retracement level for confluence around the support. The buyers leant on the red 21 moving average to position for a rally back into the trendline, but they will need the price to break above the support turned resistance to invalidate the bearish bias.
Russell 2000 Technical Analysis – 1 hour Timeframe
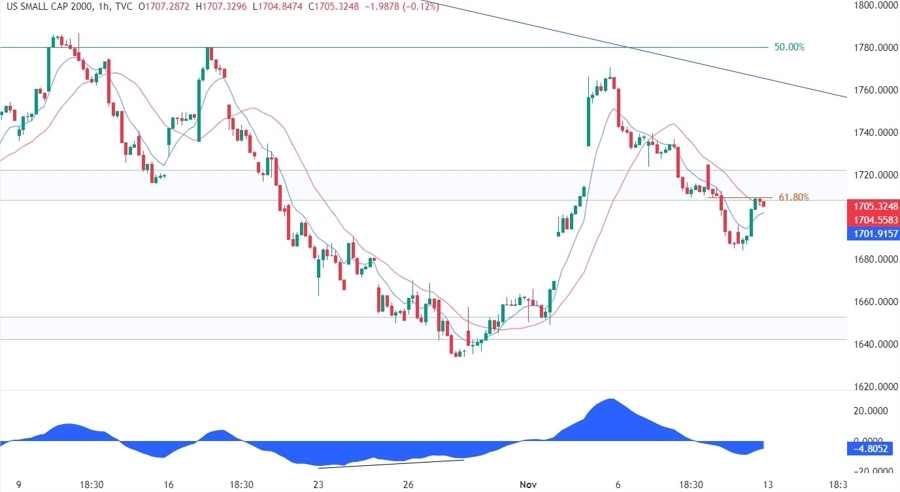
On the 1 hour chart, we can see that the sellers are likely to pile in at the resistance level as they have also the confluence with the red 21 moving average and the 61.8% Fibonacci retracement level. The buyers, on the other hand, will want to see the price breaking higher to increase the bullish bets into the trendline and target a breakout.
Upcoming Events
This week we have some top tier economic releases. We begin tomorrow with the US CPI report which is going to be one of the most important events of the week. On Wednesday, we have the US Retail Sales and PPI data, while on Thursday we conclude with the latest US Jobless Claims figures.
