Yesterday, the Fed left interest rates unchanged as expected with basically no change to the policy statement. Fed Chair Powell repeated once again that they are “proceeding carefully” as the full effects of the policy tightening have yet to be felt.
There were some expectations for him to hint or signal something for the December meeting given that the September Dot Plot showed another rate hike by the end of the year, but Powell instead said that they “have not made any decisions on future meetings” sparking a rally in the Russell 2000.
On the data front, yesterday the US Job Openings beat expectations, but the ISM Manufacturing PMI missed by a big margin. The market might be taking this as good news for a relief rally in the short term, but the bulls may want to be careful going forward.
Russell 2000 Technical Analysis – Daily Timeframe
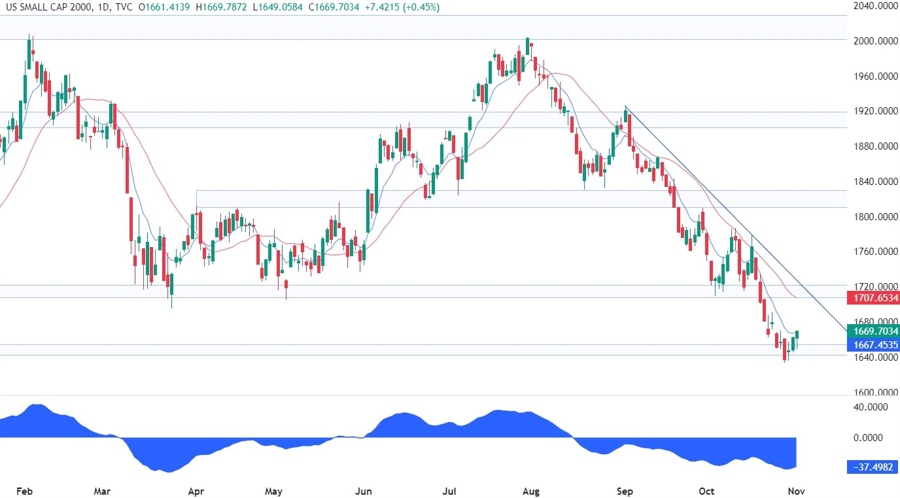
On the daily chart, we can see that the Russell 2000 avoided a complete breakdown as the price rallied back above the 3-year low. From a risk management perspective, the sellers would be better off waiting for the price to come back into the 1700 resistance zone where they will also find the confluence with the trendline and the red 21 moving average.
Russell 2000 Technical Analysis – 4 hour Timeframe
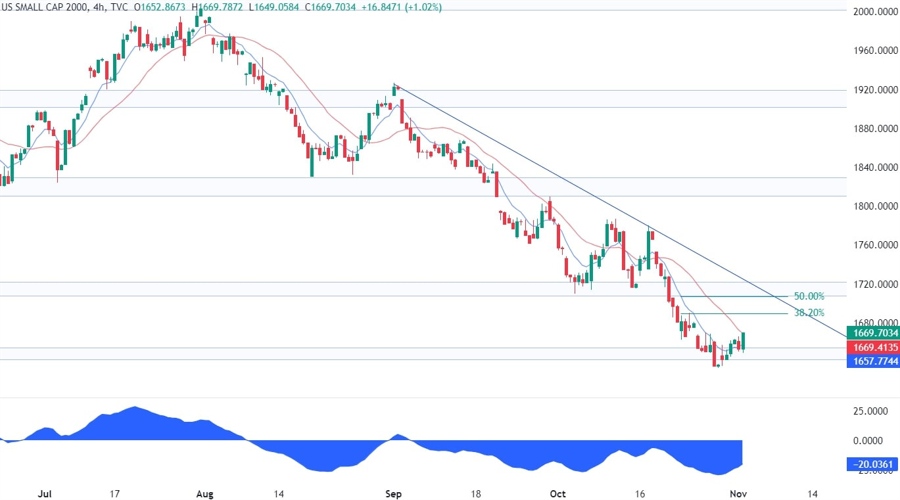
On the 4 hour chart, we can see that we even have the Fibonacci retracement levels adding an extra layer of confluence around the 1700 resistance. This should be the target for the buyers in the short term unless the economic data comes out really bad sparking fears of a recession.
Russell 2000 Technical Analysis – 1 hour Timeframe
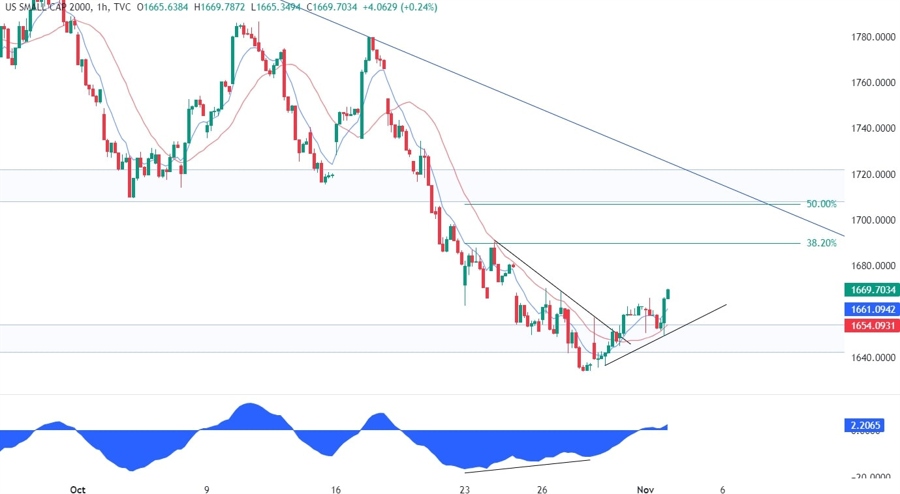
On the 1 hour chart, we can see that we had a divergence with the MACD right when the Russell 2000 was falling below the 3-year low. This is generally a sign of weakening momentum often followed by pullbacks or reversals. In this case, given the break above the minor downward trendline, we should see a reversal back into the 1700 resistance.
If the price pulls back, the buyers are likely to lean on the minor upward trendline where they will also have the red 21 moving average for confluence. If the price breaks below the upward trendline and the support zone though, the sellers are likely to pile in and target new lows.
Upcoming Events
Today, we have only the US Jobless Claims data, which will be important for the market given the recent weakness in Continuing Claims. Tomorrow, we conclude the week with the US NFP report and the ISM Services PMI.
